Purpose of the MBV map
Biodiversity is all the living world: native plants, animal and other living things. Victoria's marine and coastal environments support a variety of biodiversity features.
DEECA created the MBV map to support spatial planning and decision-making. The updateable map provides spatial information on marine and coastal biodiversity features. The MBV map version 1 (2024) is the first comprehensive statewide data synthesis.
The MBV map supports Biodiversity 2037's vision that Victoria's biodiversity is healthy, valued, and actively cared for.
Creating the MBV map
We made the MBV map by assessing data and spatial information. The map ranks all locations across Victoria's marine waters and 5km inland, from low (0) to high (100). A location with a high value (close to 100) supports many different marine and coastal biodiversity features. These are important areas, few or no other locations have the same features.
The MBV map shows the relative importance of Victoria's marine and coastal areas. The steps below outline how we made the map and more technical information.
The map extent was created to align with Victoria’s marine and coastal environment defined by Victoria’s Marine and Coastal Act 2018 which extends 5 km inland from the Victorian coastline to 3 nm offshore.
The spatial resolution of the MBV map was defined by grid cells, the standardised spatial components used for data processing or planning within a given land or seascape that divide the study area. Grid cells were defined as square units of 225 m2, resulting in a total of 401,448 units. The grid cell size was selected to align with DEECA's terrestrial mapping outputs and tools as displayed on NatureKit, to support planning across both land and sea.
Marine and coastal biodiversity features were selected for inclusion in the assessment based upon the below criteria:

- Listed species and communities – under Victoria’s Flora and Fauna Guarantee Act 1988 (FFG Act) or under the Australian Government's Environment Protection and Biodiversity Conservation Act 1999 (EPBC Act).
- Habitat features – 24 statewide marine habitat complexes mapped in the statewide marine habitat map.
- Key biodiversity features – defined here as biodiversity features that are not currently listed under the FFG Act, EPBC Act, or recognised as a statewide marine and coastal habitat, however, are considered to have important cultural, economic, ecological, or social value.
A total of 311 marine and coastal biodiversity features were identified applying the above criteria. Spatial information was available for 263 of these. Species and community listings from the FFG Act and EPBC Act were extracted December 2023, updates thereafter have not been captured in MBV map version 1. This criterion provides a foundation for the first spatial marine biodiversity values assessment based on available species-specific information.
This assessment collated readily available spatial information and publicly accessible data. Data sources examined and included in this first assessment include:
- Biologically Important Areas (BIAs).
- BirdLife Australia.
- CoastKit.
- NatureKit.
- Species of National Environmental Significance (SNES).
- Scientific literature - species distribution maps published in peer-reviewed scientific publications or publicly available technical reports with relevance to the biodiversity features assessment criteria were sought for inclusion.
- The Victorian Biodiversity Atlas (VBA).
A data quality assessment was undertaken using the below criteria to rate each biodiversity features layer ranging from 0 (Deficient) to 4 (Best practice). The assessed data quality represents an estimate of confidence in the data source, processing techniques, and data extent.
| Data quality | Data score | Data description |
|---|---|---|
| Deficient | 0 | No data publicly available (data deficient). |
| Limited | 1 | Coarse resolution spatial data available for key areas and locations of importance and/or lack of statewide information, unsystematic data collection and processing. |
| Moderate | 2 | Spatial data has sufficient coverage across the species distribution and data-driven scientific approaches have been adopted for data collection and processing. |
| Adequate | 3 | Statewide species distribution models have been created utilising the best data available and information. |
| Best practice | 4 | Species distribution models have been created and consider temporal movements, connectivity, migration routes and have been refined by stakeholder input. |
Zonation is a freely available software that is powerful, robust, well-vetted and widely used across the globe for spatial planning. This analysis ranks all locations across Victoria for their ability to represent marine and coastal biodiversity features. Zonation produces a complementarity-based and balanced ranking of conservation priority over the entire landscape, taking into account both species richness and rarity. New capabilities have been built into Zonation 5 which include a superior meta-algorithm to improve processing time and capabilities to handle large amounts of spatial data.
The first statewide MBV map was developed comprising 263 marine and coastal biodiversity features. The MBV map highlights areas of Victoria’s marine environment with low to high biodiversity values, ranked from 0-100.
High biodiversity areas (values close to 100) play an important role in supporting a wide variety of marine and coastal species and habitats. The highest ranked sites are also those most irreplaceable and are areas to protect, conserve or avoid impacting where possible.
Lower biodiversity areas (values close to 0) may indicate either areas where not enough information has been collected to understand the biodiversity in that location, inland areas that may not be particularly valuable for marine and coastal biodiversity features but are important for terrestrial species, or areas where habitats tend to be more homogenous, such as open sandy areas, and hence support fewer species.
The MBV map provides an initial assessment and has enabled a first-of-its kind data inventory and stocktake for marine and coastal biodiversity features occurring in Victorian waters. Over half (60%) of biodiversity features had limited to deficient data quality, with minimal information available for offshore environments, migration routes, and distribution patterns.
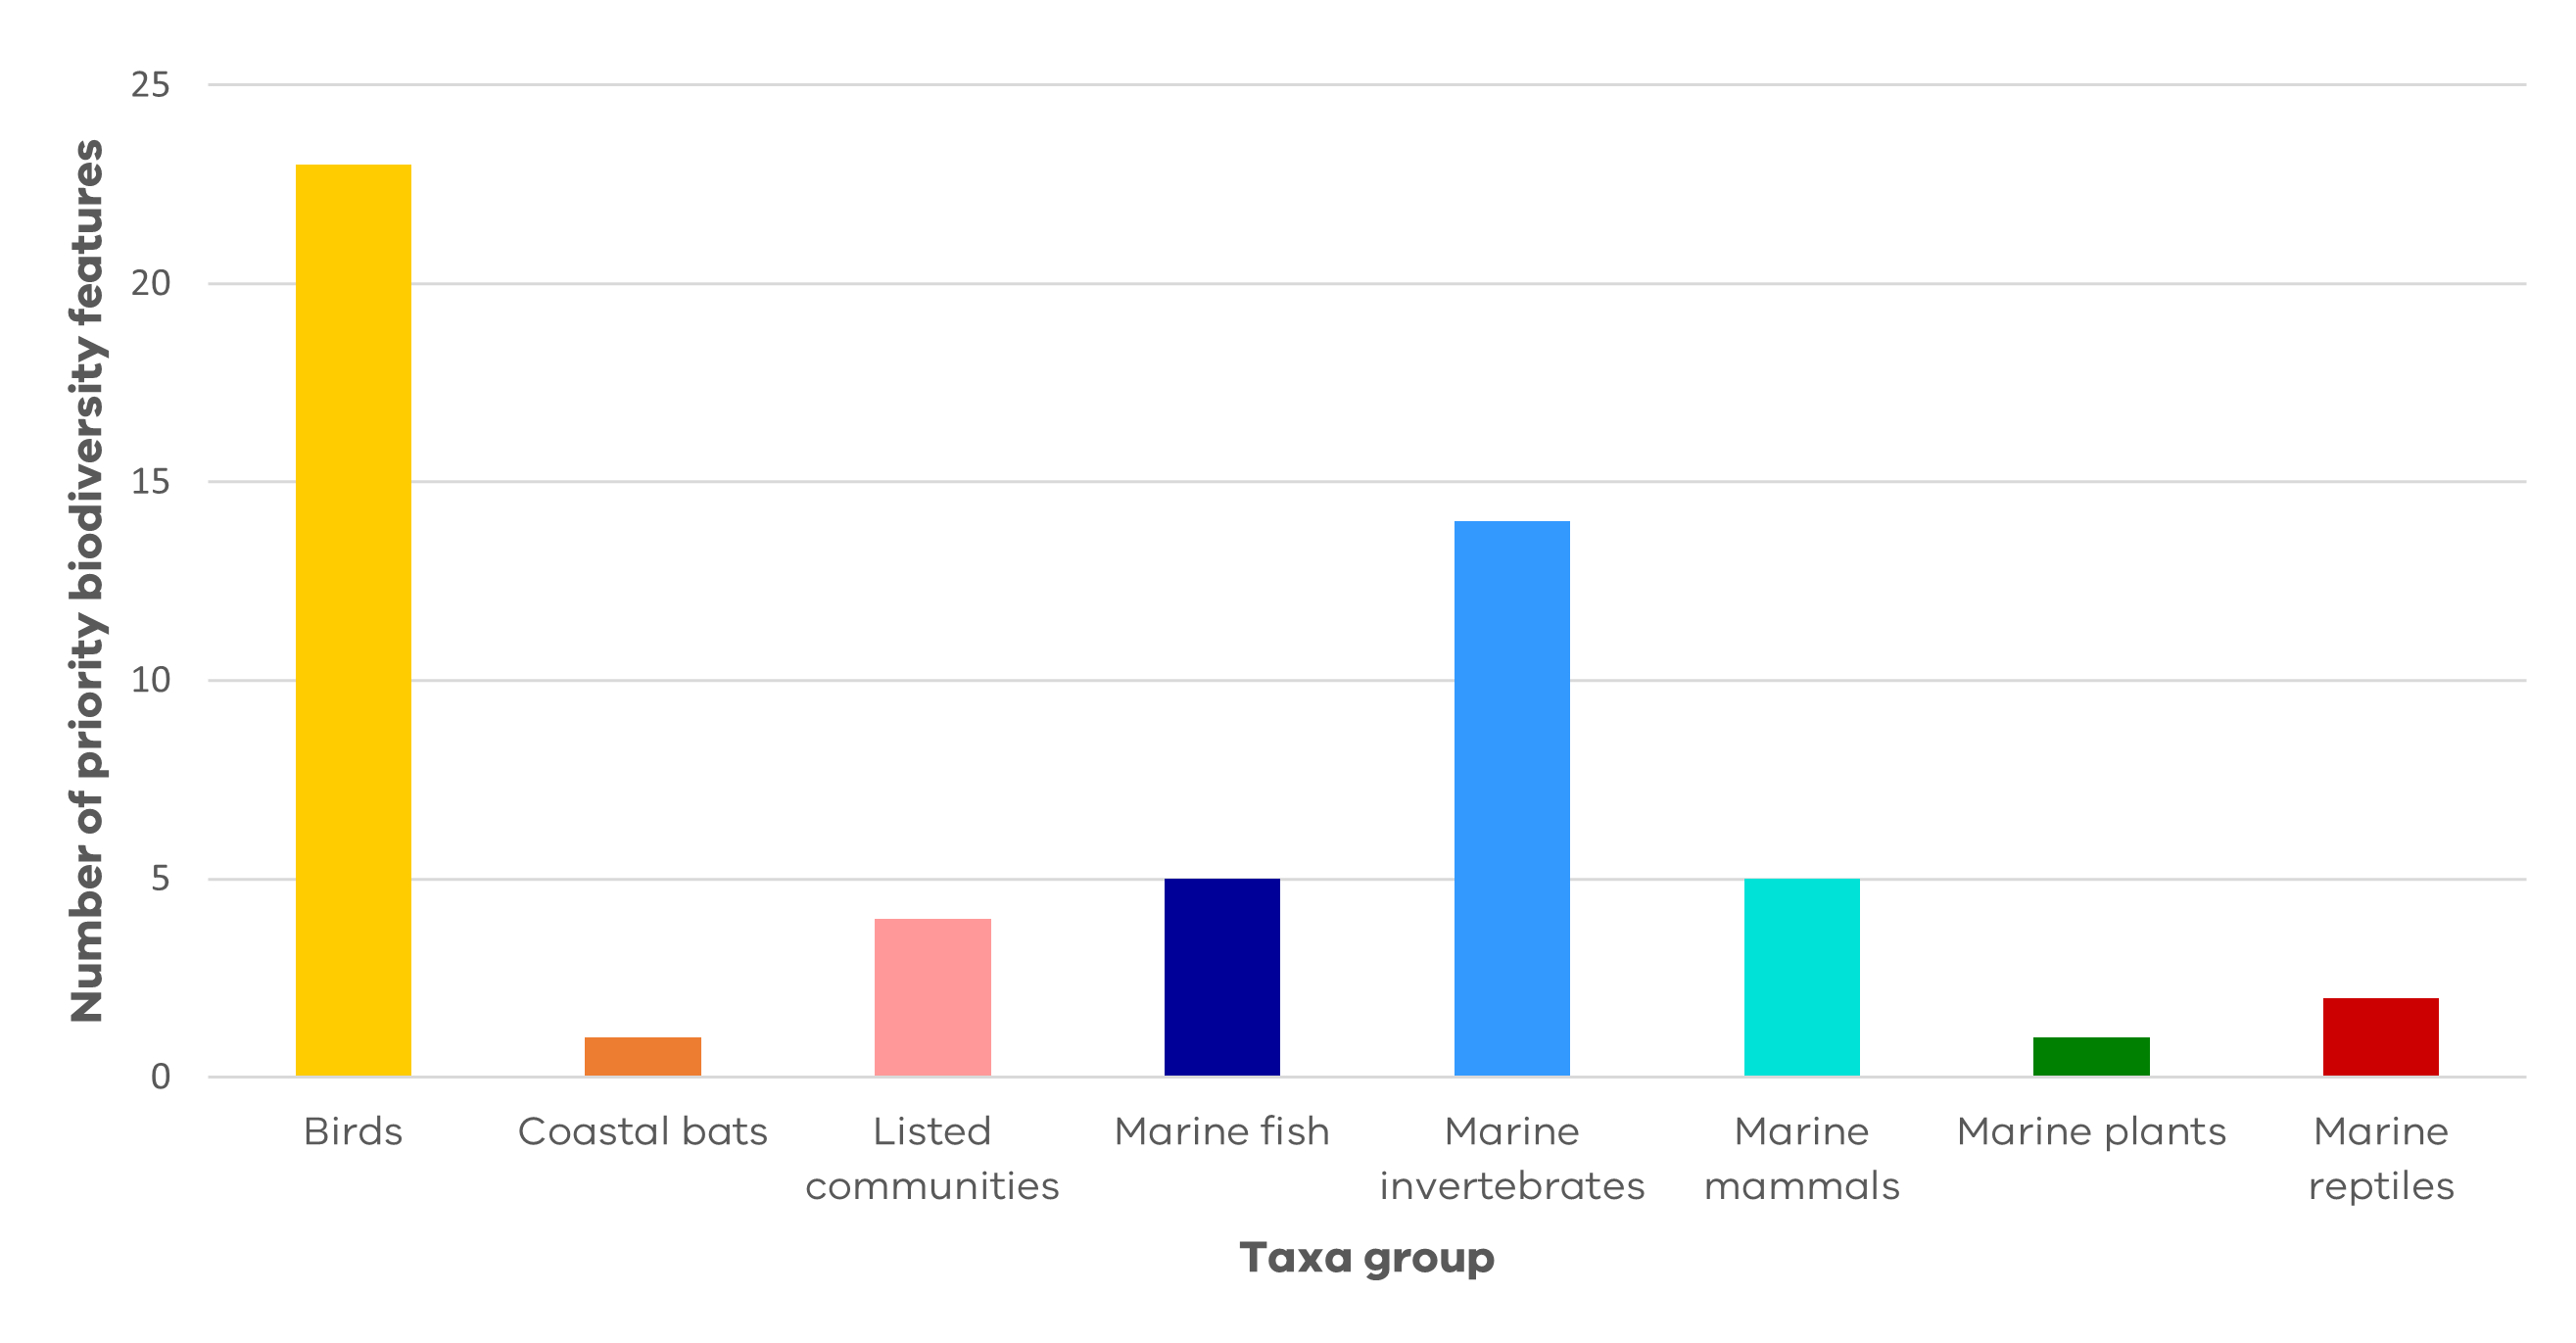
55 priority biodiversity features for data improvement were identified as those with the highest priority for further data collection (below graph). The data quality assessment and inclusion criteria were combined to select biodiversity features that are:
- Species or communities listed as Critically Endangered or Endangered under the FFG and/or EPBC Acts, and
- Data quality score of 0, 1 or 2 representing deficient, limited, or moderate data, or
- A migratory species where spatial information on movement patterns and migratory pathways is absent.
Species include albatrosses, the grey nurse shark, Burrunan dolphin, the southern right whale, far eastern curlew, sea cucumber and sea slug species, the swift and orange bellied parrots, and the leatherback sea turtle. Additionally, 4 EPBC listed communities were identified including the giant kelp (macrocystis) marine forests of Southeast Australia.

Applying the MBV map
The primary purpose of the MBV map is to provide information on marine and coastal biodiversity to support spatial planning decisions and decision making. The output is widely applicable to numerous uses, including:

- Development planning and approvals (site planning, environmental impact assessments, FeAST).
- Marine Spatial Planning (MSP).
- Land-sea planning (e.g. regional planning).
- Protection and conservation planning (areas of highest biodiversity values).
- Scientific research and ecological monitoring (identify species to monitor within a site).
- Biodiversity offsets.
- Threatened species management.
- Restoration opportunities.
Careful consideration needs to be taken when applying the map given limitations around the paucity of marine biodiversity data and information. Further details can be found within the MBV technical report.
The full technical report for creating the MBV map can be accessed here:
Continuous improvement
DEECA is committed to a continuous improvement approach, which enables the products and tools to be updated and refined as further data, computational power, research, and modelling methods become available. All biodiversity values mapping products have a version number and year to help identify the currency of each product. Everyone can contribute to the improvement of biodiversity mapping products by
- submitting species records to the Victorian Biodiversity Atlas, or
- directly providing data by contacting DEECA’s Marine Knowledge Team at Coastkit@deeca.vic.gov.au.

Photo credit: Marcia Riederer
Page last updated: 16/07/24

 (PDF, 2.4 MB)