1. Overview
The FeAST risk assessment adopts a uniform process for evaluating a proposal’s potential environmental impact on marine and coastal habitats. The results from the assessment are presented in a standardised report, which is available for download after the tool has been run. The three key outputs in FeAST assessment report can be divided into the:
- FeAST score: this presents the final results of the FeAST risk assessment and provides an indication of the level of risk (either low, medium or high) as posed to the habitat by the proposal's activities.
- Marine Biodiversity Values: this analysis indicates how much of the proposal intersects with high biodiversity value areas and lists the associated species likely to occur.
- Proximity analysis: this provides tables of the key marine and coastal features for further investigation which are located directly within the defined project area or within a 2km buffer from the project boundary.
The FeAST score is calculated by the tool in three automated steps, these include:
This first step identifies all the pressures likely to arise from the selected activities and evaluates the intensity. The Pressure score indicates the potential effect that each activity may have on the ecosystem under normal conditions.
This is the second step in calculating the overall FeAST score. This score provides a total sensitivity value for each habitat type within the defined project area for pressures with a medium or high Pressure score. The sensitivity is a measure of the habitat’s response to the activities in terms of its ability to resist or recover from impact.
This final score provides an overall risk level for the proposal, evaluating the Habitat scores and Pressure scores against the estimated exposure level. The exposure level is determined by calculating the spatial overlap of the defined project area with the habitat's known distribution across each of the 26 distinct Victorian biounits.
2. Key components
The design of FeAST follows an ecosystem-based management approach attempting to systematically capture the complex interactions and impacts of activities on the marine environment. To achieve this, the Driver-Pressure-State-Impact-Response (DPSIR) cause-and-effect framework has been employed (Maxim et al, 2009).
Currently FeAST includes the ‘D’, ‘P’ and ‘I’ of the framework, with work underway to determine the ‘State’ of habitats i.e., the condition, health, or quality. The ‘Response’ is the management actions to control the risk or impact, and this can relate back to regulations, action plans and mitigation measures. Response is outside the scope of FeAST.
There are four key components in the FeAST data inventory that are used to generate the FeAST score: Activity, Pressure, Habitat and Biounit, as displayed in the diagram below:
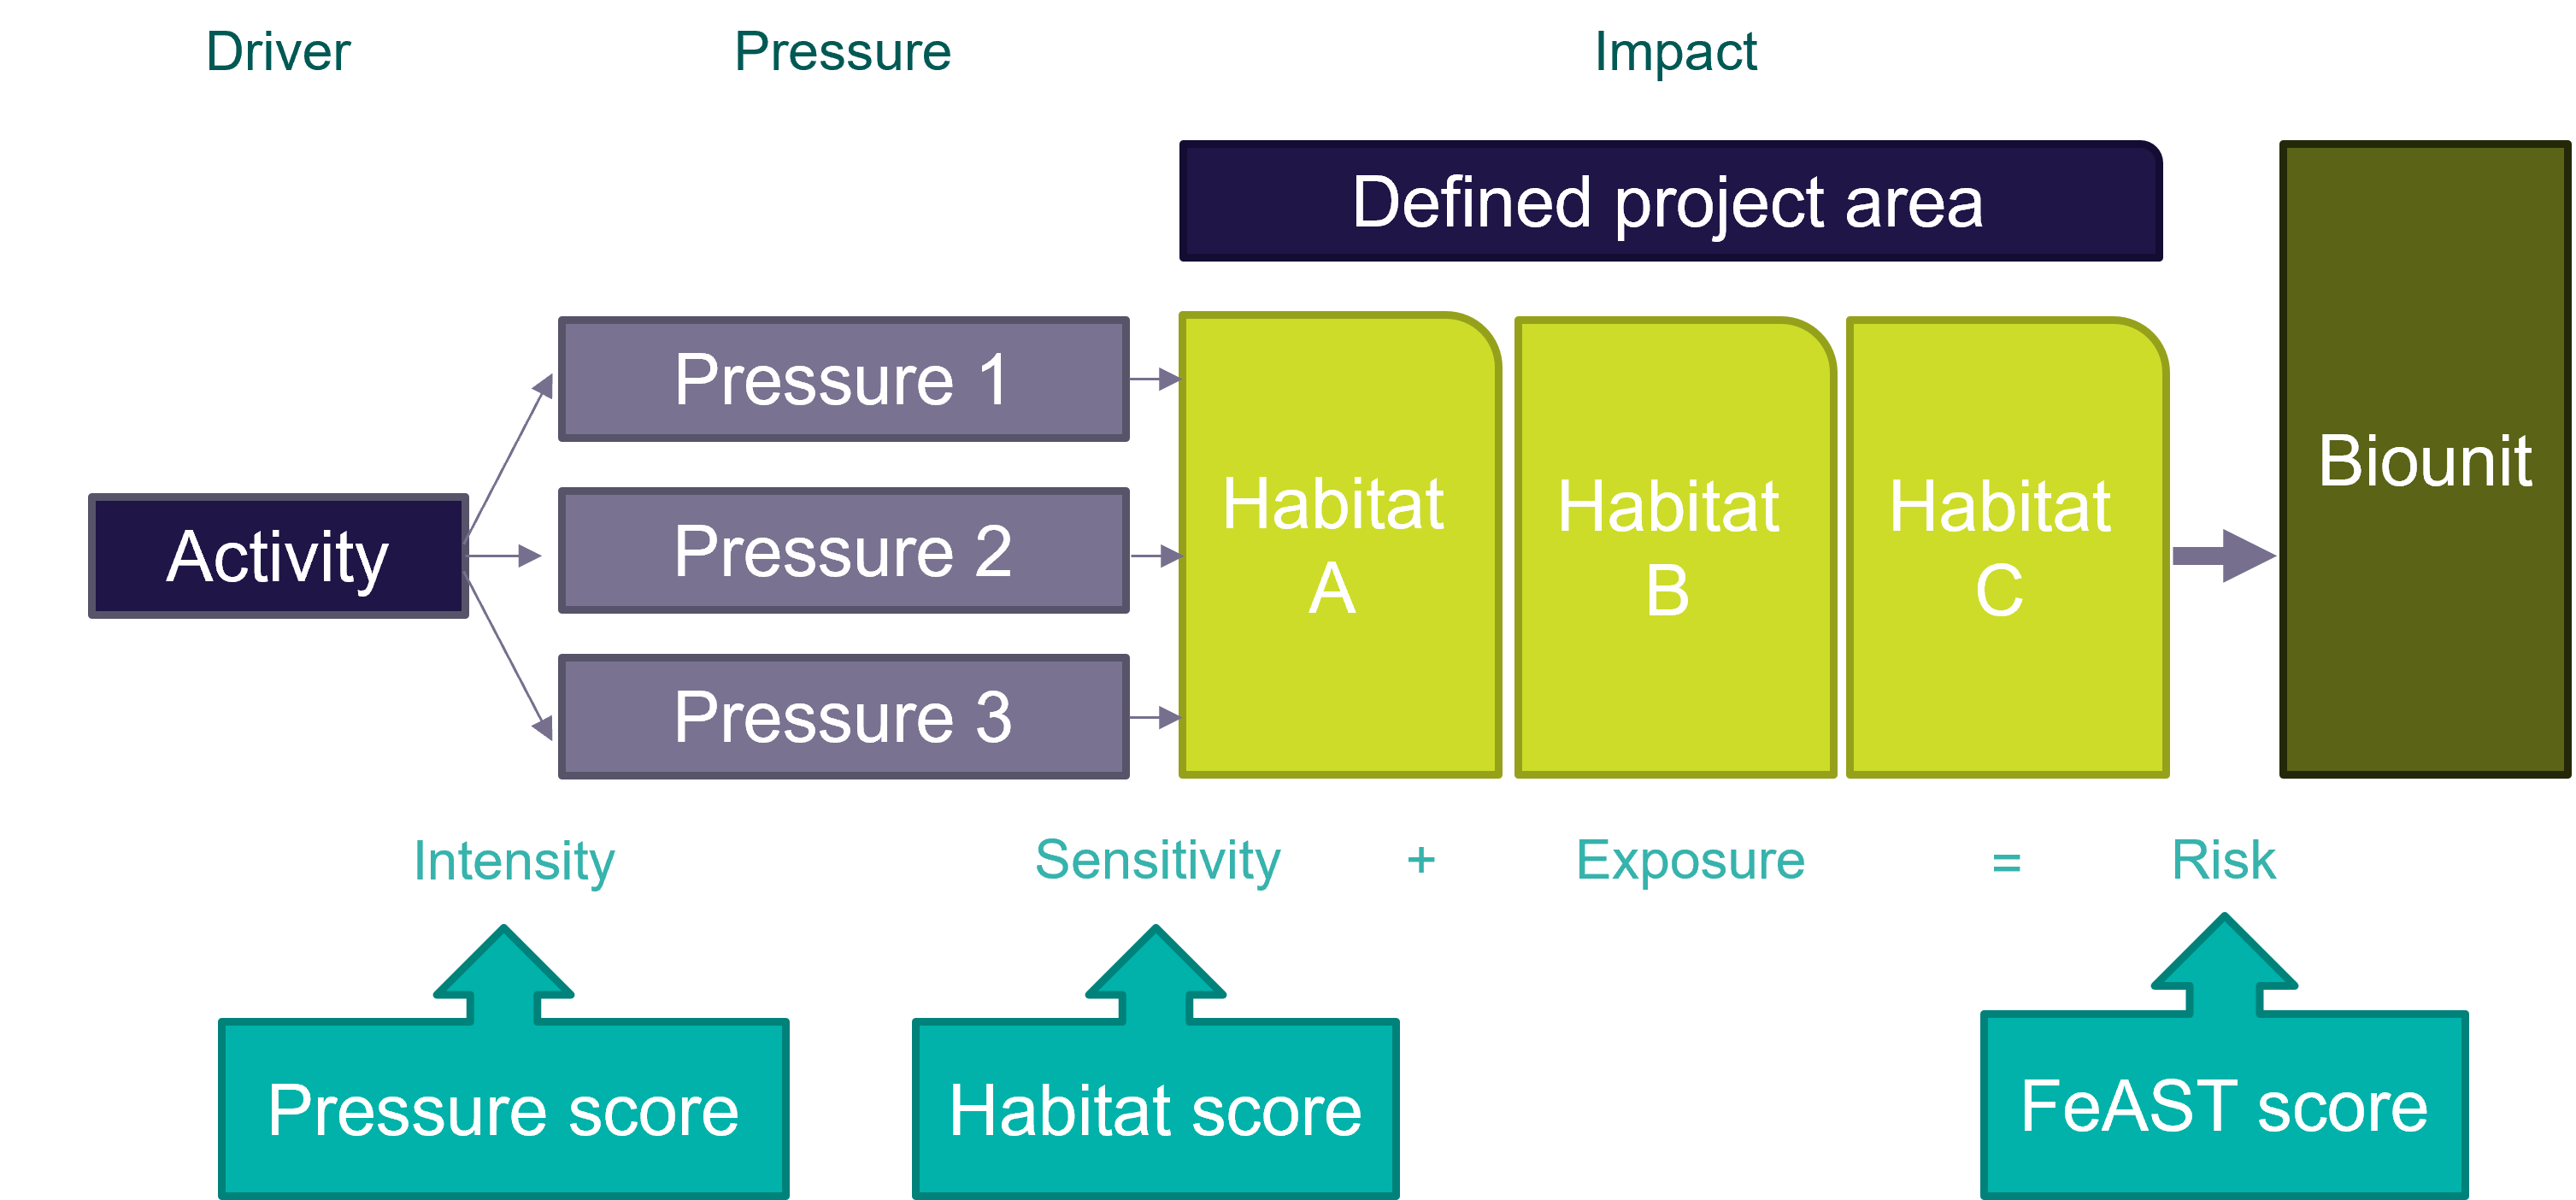
Activities represent the ‘Driver’ and are selected by the user. Multiple activities can be selected from a standardised list of over 130 different uses, works or developments likely to occur in the marine and coastal environment. These human-influenced activities are grouped into twelve activity categories in the tool and described in the below table. A full list of activities and their descriptions can be found on the Supporting information page.
| Activity category | Category description | Number of activities |
|---|---|---|
| Coastal infrastructure | The development and maintenance of coastal infrastructure such as ports, marinas and harbour developments. | 18 |
| Coastal management activities | Activities related to management of coastal sites. This does not include the development or maintenance of infrastructure, such as sand scraping. | 10 |
| Defence and national security | Activities conducted by the military within the marine environment such as aerial military activities. | 4 |
| Energy generation | Activities related to the development, operation, maintenance and decommissioning of structures and wider developments which generate energy or are related to energy generation. | 19 |
| Extraction of non-living resources | Activities which include the extraction and disposal on non-living marine resources such as aggregate dredging. | 10 |
| Extraction of living resources | Activities relating to the extraction of living marine resources such as fishing activities. | 22 |
| Other man-made structures | Man-made structures in the marine environment which are not covered elsewhere. | 9 |
| Production of living resources | Activities relating to the production of living marine resources such as aquaculture. | 7 |
| Recreation and leisure | Activities relating to recreational pursuits such as swimming and the use of light aircraft. | 15 |
| Research | Activities relating to the investigation and study of the marine environment for both scientific and exploratory purposes; includes activities such as sonar, and exploratory drilling. | 6 |
| Transport | Activities directly involving transport such as vessel movements or relating to the support of transport activities such as vessel moorings. | 9 |
| Waste management activities | Activities which include the disposal or discharge of liquid waste into the marine environment. | 2 |
Activities can exert a range of impacts, hazards or threats on the environment resulting in physical, biological, or chemical changes. These are referred to as pressures in FeAST. Each activity in the FeAST data inventory has specific pressures assigned from a standardised list of 39 possible combinations. The pressures are classified into five pressure categories based on the type of effect on the ecosystem, as displayed in the below table.
More information on the development of the FeAST data inventory and the pressures and their descriptions can be found on the Technical summary page.
| Pressure category | Category description | Number of pressures |
|---|---|---|
| Biological pressures | Includes pressures relating to the translocation of native species, escape of farmed or genetically modified species, introduction of pathogens and invasive species, removal of target and non-target species and visual disturbance. | 6 |
| Hydrological changes (inshore/local) | Includes pressures relating to changes in temperature, salinity, water movement, water levels and wave exposure. | 7 |
| Physical damage | Includes pressures relating to temporary changes such as the disturbance of the seabed surface and sub-surface, changes to habitat structure and water clarity as well as heavy and light siltation and smothering effects. | 6 |
| Physical loss | Includes pressures relating to permanent changes such as the removal of habitats and the change of sediment or habitat type. | 3 |
| Other physical pressures | Includes pressure relating to above water and underwater noise, vibration, electromagnetic changes, underwater noise changes, introduction of light and litter and the mortality of biota from collision above and below the water. | 9 |
| Pollution | Includes pressure relating to hydrocarbon, synthetic compound, radionuclide, transition elements and organo-metal contamination, in addition to nutrient and organic enrichment, deoxygenation and the introduction of liquids, solids or gases. | 8 |
The pressures are analysed for expected impact on each habitat mapped within the defined project area. There are 23 habitats in Victoria used in the FeAST data inventory, and covering four marine and coastal zones: littoral, sublittoral, infralittoral and circalittoral zones.
The habitats are mapped to the scale of CBiCS level 3 (habitat complex) and have a biotic code as displayed in the Biotope Atlas on CoastKit. The below table shows the habitat types used by FeAST. More information on habitat description and type can be found on the Supporting information page.
| Biotic code | Habitat complex | Substrate | Marine and coastal zone |
|---|---|---|---|
| ba1.1 | High energy littoral rock | Rock | Littoral |
| ba1.2 | Moderate energy littoral rock | Rock | Littoral |
| ba1.3 | Low energy littoral rock | Rock | Littoral |
| ba2.1 | Littoral coarse sediment | Sediment | Littoral |
| ba2.2 | Littoral sand | Sediment | Littoral |
| ba2.3 | Littoral mud | Sediment | Littoral |
| ba2.5 | Saltmarsh and reedbeds | Sediment | Littoral |
| ba2.6 | Mangrove | Sediment | Littoral |
| ba2.7 | Littoral sediment seagrass | Sediment | Littoral |
| ba3.1 | High energy infralittoral rock | Rock | Infralittoral |
| ba3.2 | Moderate energy infralittoral rock | Rock | Infralittoral |
| ba3.3 | Low energy infralittoral rock | Rock | Infralittoral |
| ba4.1 | High energy open coast circalittoral rock | Rock | Circalittoral |
| ba4.2 | Tide-swept channels of circalittoral rock | Rock | Circalittoral |
| ba5.1 | Sublittoral coarse sediment | Sediment | Sublittoral |
| ba5.2 | Sublittoral sand and muddy sand | Sediment | Sublittoral |
| ba5.3 | Sublittoral mud | Sediment | Sublittoral |
| ba5.4 | Sublittoral mixed sediments | Sediment | Sublittoral |
| ba5.5 | Sublittoral rhodolith beds | Sediment | Sublittoral |
| ba5.6 | Sublittoral biogenic reefs | Sediment | Sublittoral |
| ba5.7 | Sublittoral seaweed on sediment | Sediment | Sublittoral |
| ba5.8 | Sublittoral seagrass beds | Sediment | Sublittoral |
| ba5.b | Non-reef sediment epibenthos | Sediment | Sublittoral |
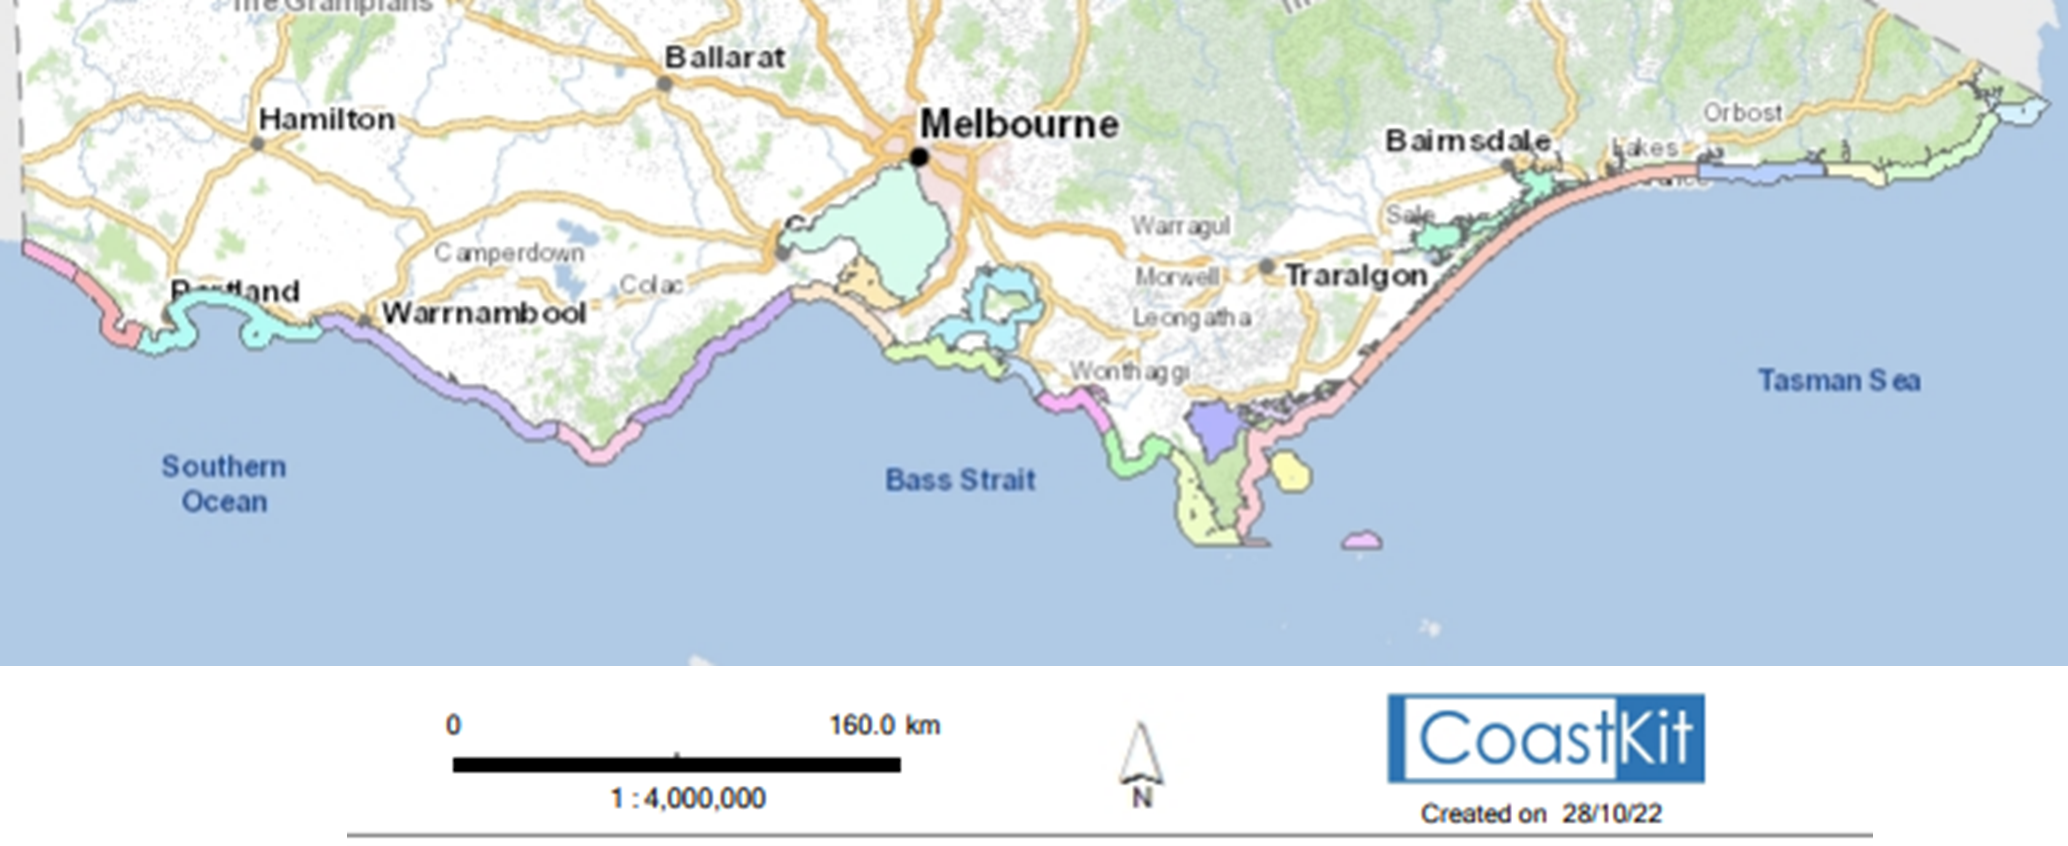
To understand the severity of the possible impact of a pressure on a habitat, the distinctiveness of each habitat within the local biounit is calculated. This determines the exposure level, a component of the FeAST score. In Victoria there are 26 biounits, which vary in size, and are categorised by their unique physiographic settings, habitats. See the below map of the biounits in Victoria. For more information see the Supporting information page.
3. Calculating the FeAST score
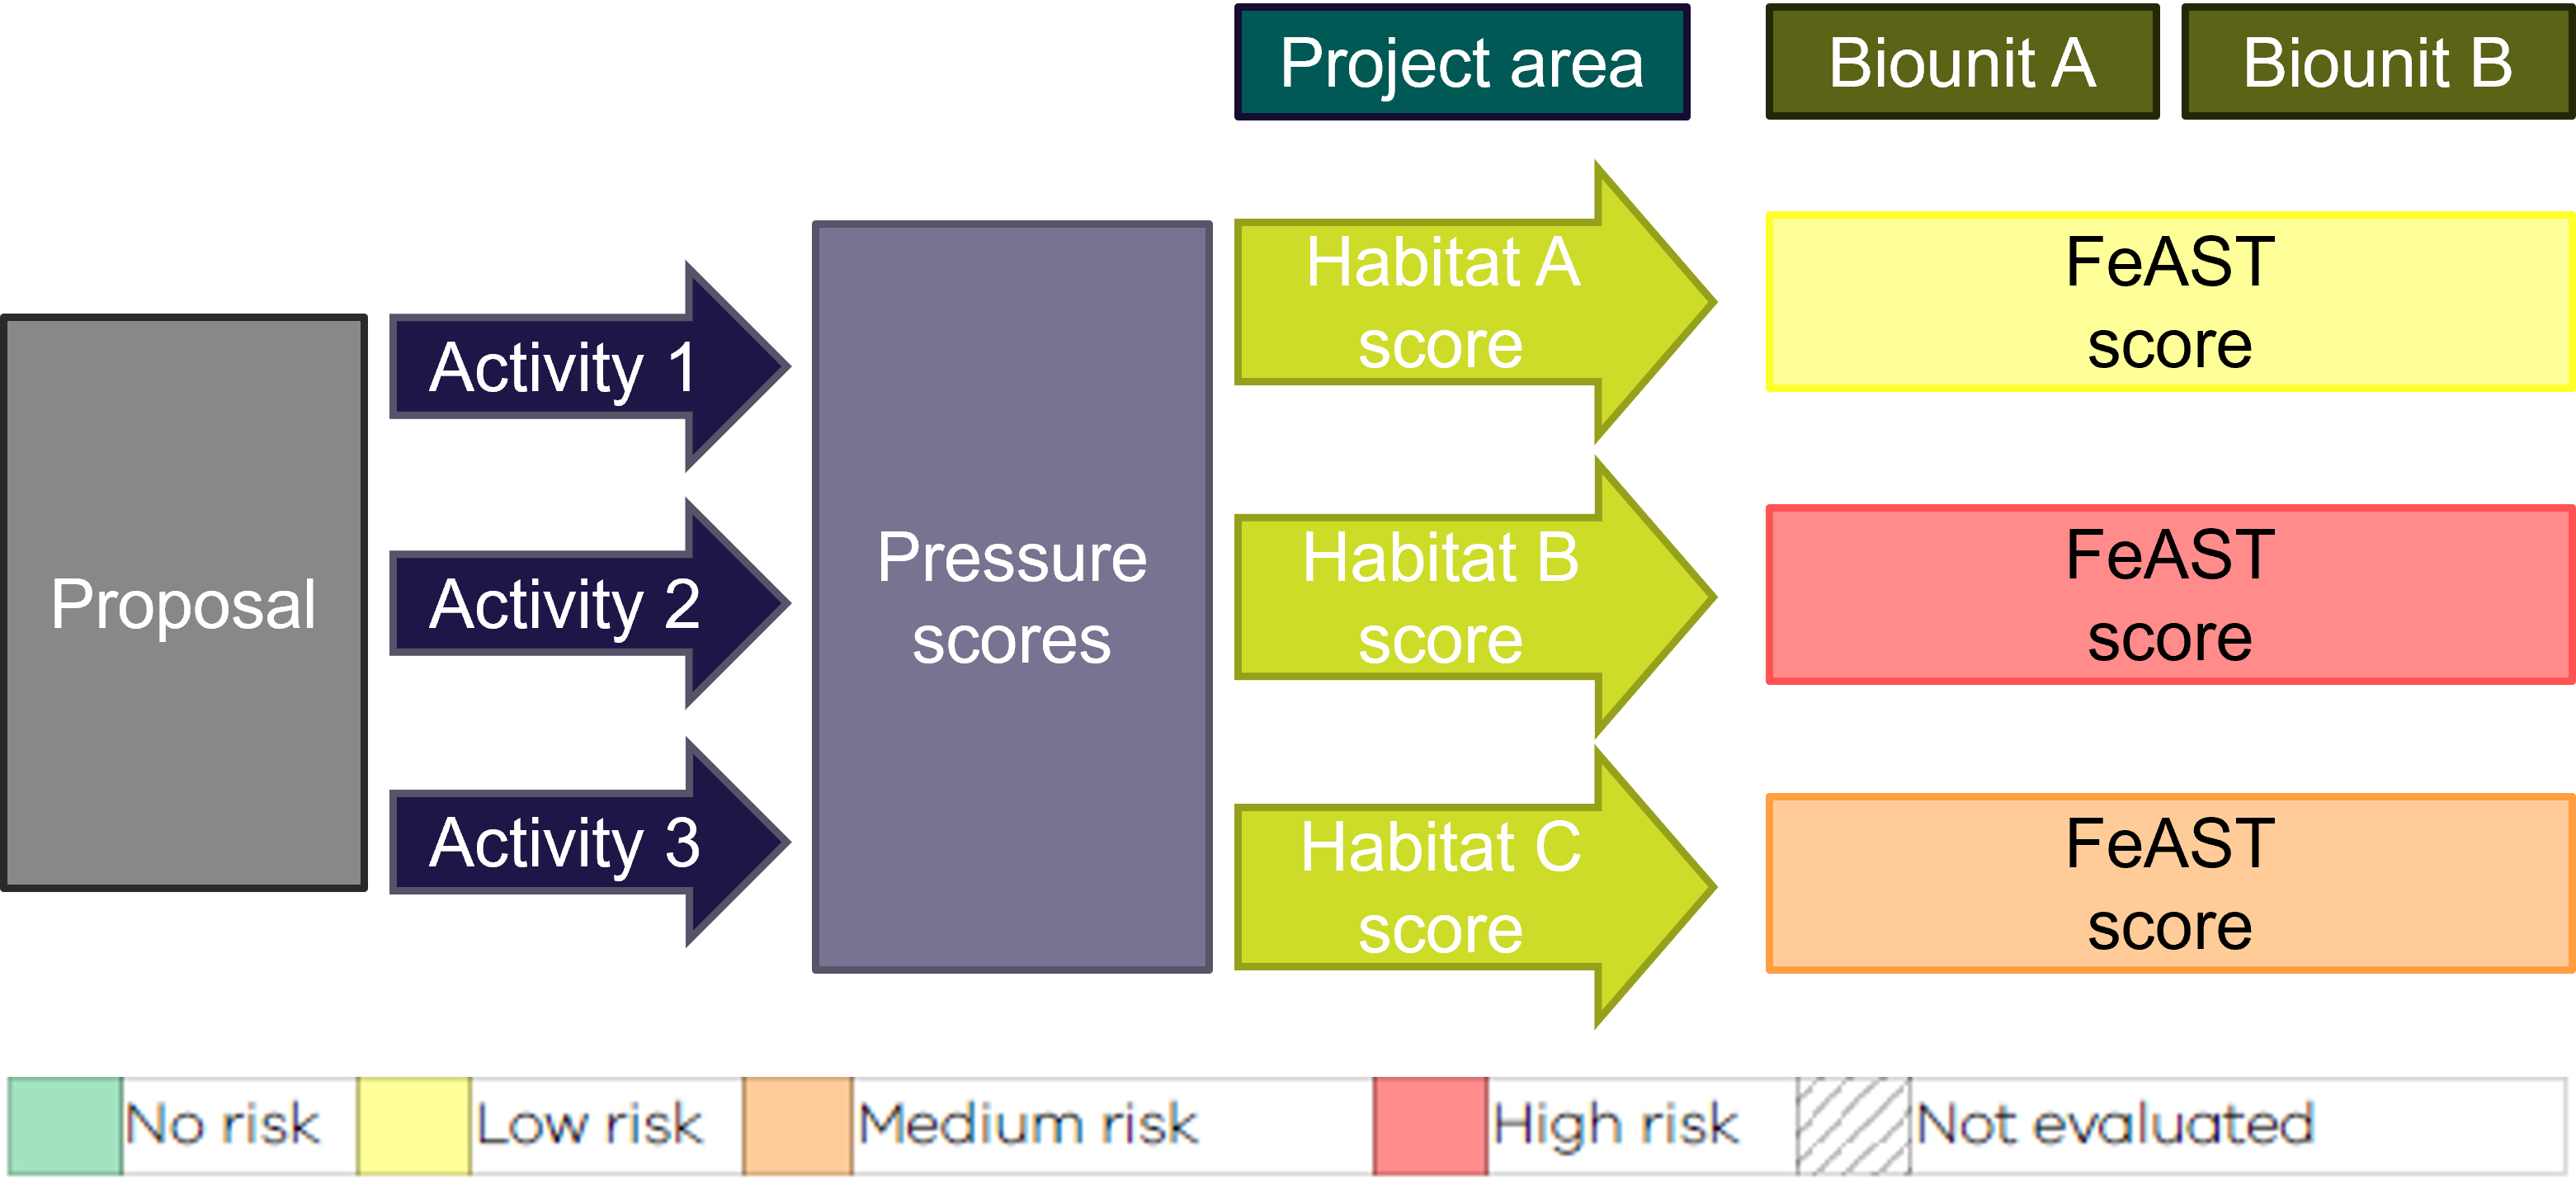
The FeAST score represents the overall risk of the proposal to each habitat found in the defined project area. The FeAST score uses the Pressure score and Habitat score to calculate risk as one of four levels: no risk, low, medium, and high. The below diagram shows the FeAST assessment process to calculate the FeAST score.
There are several instances when the tool may return the score 'not evaluated', these include:
- If the defined project area is in commonwealth waters (>3nm offshore).
- If the defined project area is in the terrestrial environment (limited coastal information).
- If the defined project area is in a gap in the habitat mapping due to limited bathymetry data (southwest coast of Victoria between Port Fairy and South Australian border).
Pressure score
The Pressure score is the first step to calculate the FeAST score. Proposed activities can exert multiple impacts, hazards or threats on the environment resulting in physical, biological, or chemical changes, these are referred to as pressures in FeAST.
In this step, each of the identified likely pressures to occur have been profiled for intensity. The Pressure score acts as a screening process to remove pressures of least concern from the FeAST assessment, where only medium and high scores are considered further.
These have been assigned based on a series of predefined benchmarks for each pressure e.g. a temperature increase of 2°C for one year, as set by scientific studies and expert opinion.
The scoring for intensity has been conducted independently of the habitat sensitivity and does not consider the spatial location or area of the proposal.
More information can be found on the Supporting information page.
The intensity scoring is based on the potential effect from low to high, where applicable. The below table shows the Pressure score intensity definitions.
| Intensity | Potential effect | Assessment in FeAST |
|---|---|---|
| High | Ecosystem functional change | Included in the FeAST assessment, with the highest score across all the activities used as the Pressure score |
| Medium | Populations and communities will shift a distinct level | |
| Low | Some noticeable change | Excluded from the FeAST assessment |
| NA | Not applicable |
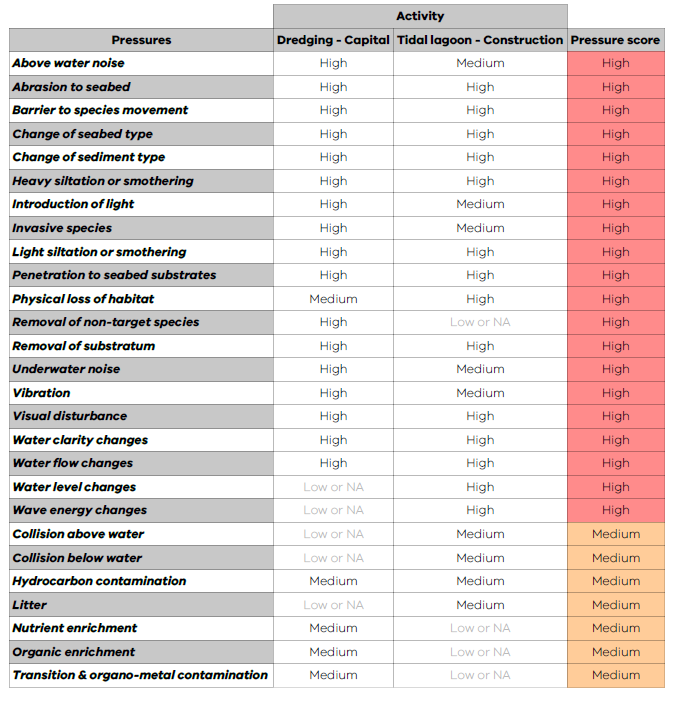
When multiple activities have been selected, the Pressure score analysis adopts a precautionary approach and takes the worst or highest intensity score across the activities as the Pressure score.
The table below shows the Pressure score results from an example report demonstrating the process when multiple activities have been selected, and low or NA scores are excluded.
More information on determining the Pressure score can be found on the Technical summary page.
Habitat score
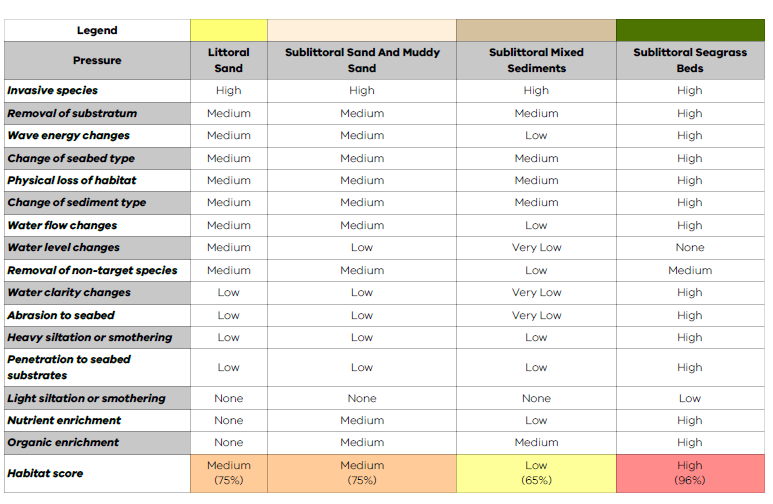
The Habitat score is the second step in calculating the FeAST score. This step evaluates the sensitivity of specific habitats, which occur within the defined project area, to each of the relevant and screened activity-induced pressures.
Sensitivity is calculated by determining the resistance, which measures the likelihood of the habitat to tolerate change, versus the resilience of the habitat to adapt and recover once the pressure has ceased.
The Habitat score provides an indication of the overall sensitivity of each habitat type to the proposal, this incorporates the combined effect of the screened pressures across all selected activities.
Each habitat is assigned a value from low to high, and none when a pressure poses no threat. The Habitat scores are calculated as a percentage, where a 100% score would indicate that a habitat type is has a high sensitivity to the proposal. The below image shows the percentage ranges for the Habitat scoring.

The Habitat score is displayed in tables in the FeAST assessment report similar to the image below.
More information about the calculating the Habitat score can be found on the Technical Summary page.
FeAST score
The FeAST score is the final step in the FeAST assessment and provides an indication of the overall risk posed by the proposal to the habitats within the defined project area. The FeAST score evaluates the level of exposure against the Habitat score.
The exposure level assesses the distribution and distinctiveness of each habitat to determine the proportional impact of the proposal, which is considered in the context of the 26 Victorian biounits.
The exposure level is determined by calculating the percentage habitat area impacted by the defined project area against the total habitat area across the relevant biounit to produce a percentage.
In cases where the proposal may cross two biounit boundaries, a precautionary approach is taken, and the highest FeAST score is used.
The image below shows an example from the FeAST assessment report demonstrating the FeAST score results and corresponding map showing the mapped habitat risk.
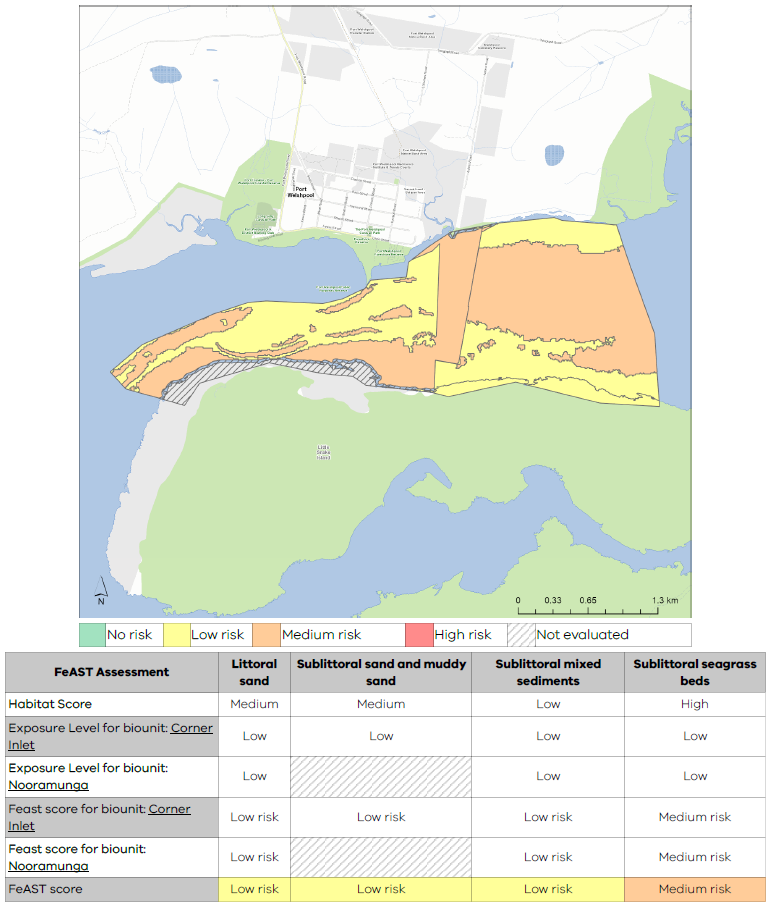
More information on the FeAST score can be found on the Technical summary page.
4. Marine Biodiversity Values (MBV)
The Marine Biodiversity Values (MBV) analysis conducts two assessments, the first identifies the extent to which the proposal overlaps with areas of high biodiversity values and the second lists the species likely to occur within the footprint of proposed activity.
The MBV analysis uses information presented by the MBV map (2024), which spans Victorian Coastal Waters and identifies areas of high biodiversity value across 225m grid cells. It evaluates 263 listed, threatened, and key marine and coastal biodiversity features assigning a spatial ranking from 0 (low) to 100 (high). These features include:
- Listed species and communities under the under the Flora and Fauna Guarantee Act (FFG Act) and the Environment Protection and Biodiversity Conservation Act (EPBC Act)
- Habitat features, such as mapped marine habitat complexes.
- Key biodiversity features that are culturally, economically, ecologically, or socially significant.
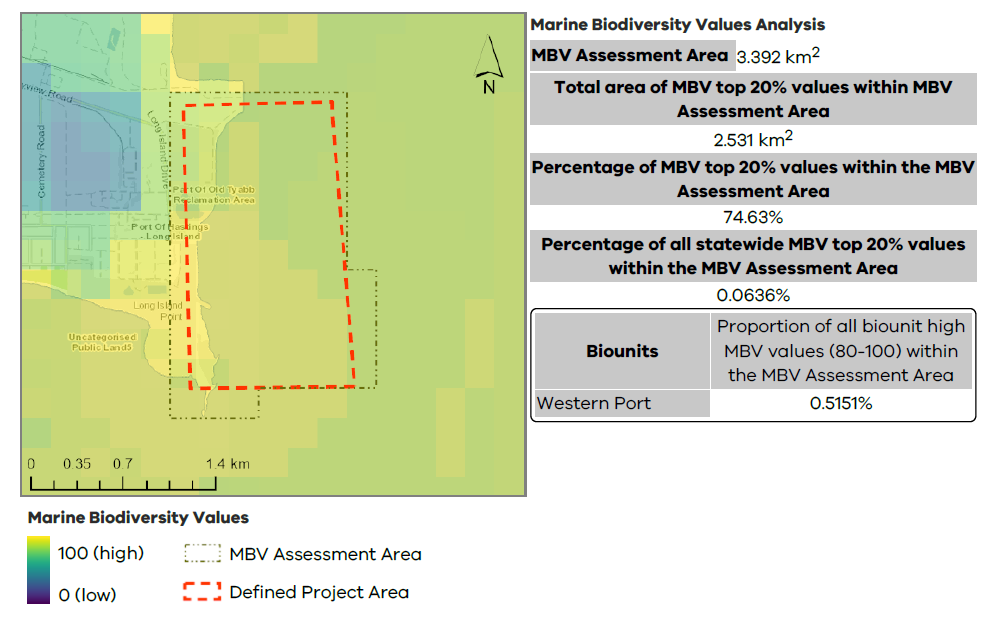
MBV Spatial Assessment: Provides an indication of how much of the highest ranked (80-100) marine biodiversity values overlap with the proposal area. The statistics provide information on the total area and percentage of high MBV areas within the proposal area, as well as the proportional overlap at a statewide and biounit level.
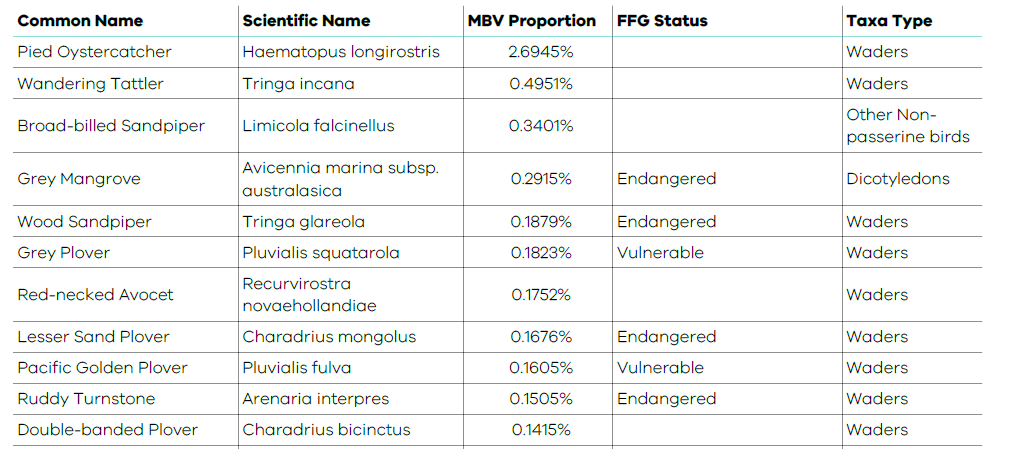
MBV Species Assessment: Provides a list of species likely to occur within the project area, including their conservation status and proportional overlap. The proportional overlap represents the percentage of each species' statewide extent that intersects with the proposal footprint.
The MBV map layer is displayed on CoastKit. Please refer to the MBV webpage for more information.
5. Proximity analysis
The Proximity analysis acts as a search tool to provide an indication of the key marine and coastal features that may occur or can sometimes occur within or nearby (up to 2km) the defined project area.
In addition to the FeAST score, it is critical for proposals to consider any impacts or negative interactions to existing marine and coastal activities, the natural environment and biodiversity, as well as designated conservation management and protection areas.
The tool generates a series of summarised tables from the Feature Atlas on CoastKit. Tables are organised into eight themes:
- Conservation and protected areas.
- Natural environment and biodiversity.
- Defence and national security.
- Energy generation and resource extraction.
- Fishing and aquaculture.
- Marine transport.
- Recreation, tourism, and leisure.
- Scientific and heritage areas.
Each table in the FeAST assessment report provides the feature category, feature name, description, and proximity. Feature records are ordered from largest overlap to furthest distance away.
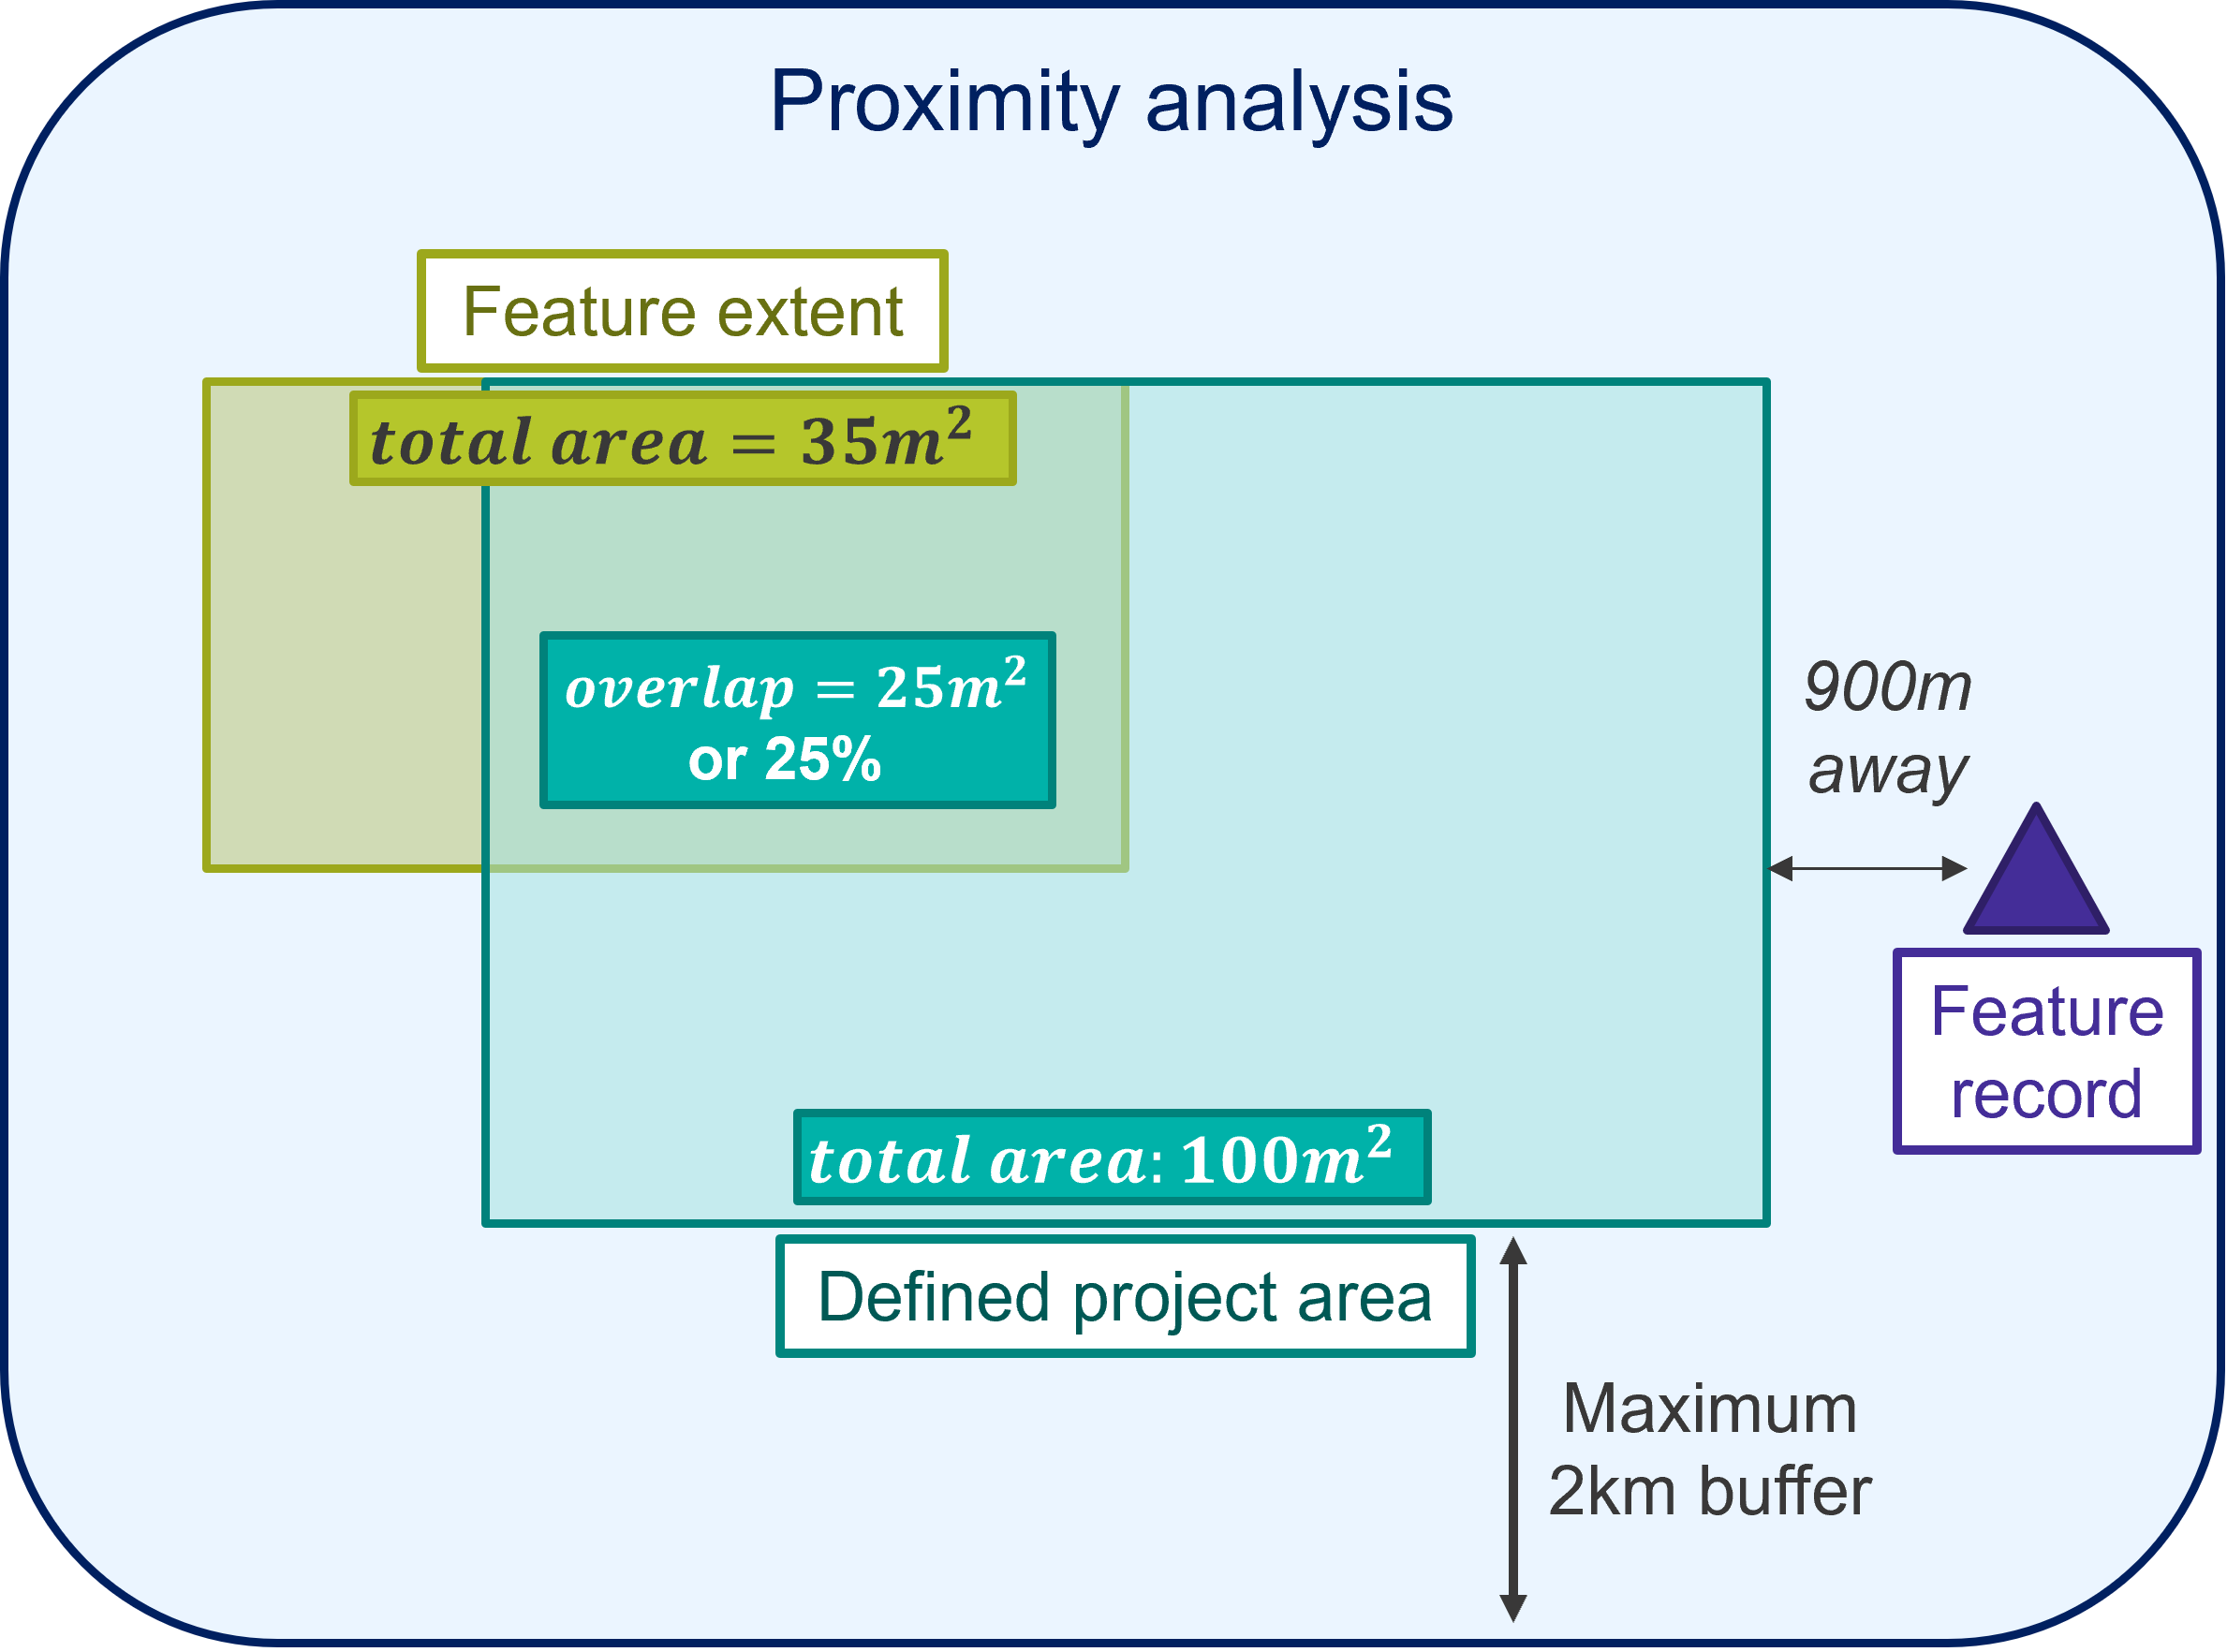
The proximity value in the tables is displayed as either:
- Percentage overlap (%): provides an indication of how much of the total defined project area is covered by the feature.
- Distance in metres (m): provides an indication of how far the feature is from the boundary of the defined project area to a maximum buffer of 2km.
The diagram below shows the two ways proximity can be displayed in the FeAST report. In this example 25m2 of the total defined project area (100m2) is covered by the feature’s extent which is equal to 25% overlap. Additionally another feature record has been identified 900m away from the boundary of the defined project area within a 2km buffer zone.
The number of tables displayed in the report will vary. If no features from a theme have been identified within 2km of the defined project area boundary, the corresponding table will not be displayed in the report.
Some key spatial datasets have not been included in the Proximity analysis, please refer to the Using the FeAST report page for recommended tools to use in conjunction with FeAST. The Proximity analysis does not evaluate the potential risk posed to habitats, this is assessed under the FeAST score.
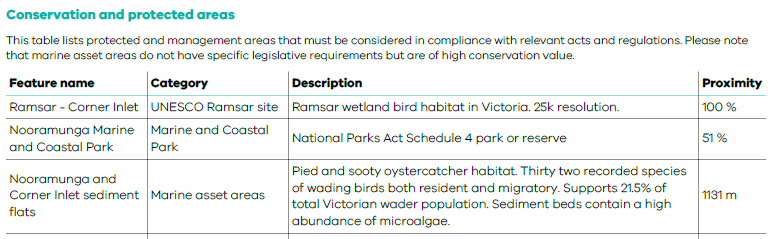
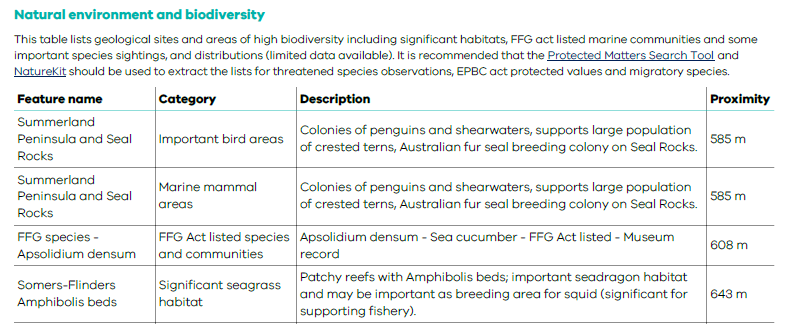
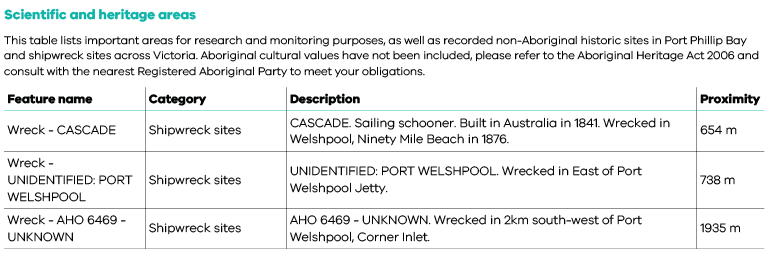
The images below show examples of tables from the Proximity analysis in the FeAST assessment report including Conservation and protected areas, Natural environment and biodiversity and Scientific and heritage areas.
The Proximity analysis provides users with important foundational data to use as a starting point for managing and mitigating any environmental risks that may arise from the proposal. This may consist of a user-driven risk appraisal to assess the likelihood of any negative or undesirable impacts and interactions.
The information provided in the Proximity analysis is indicative only and is based on available data that may be limited geographically, temporally, or otherwise incomplete. In cases where more accurate or up-to-date supplementary information exists, this should be used additionally to inform analysis beyond the FeAST assessment, see Using the FeAST report page.
Page last updated: 18/09/25