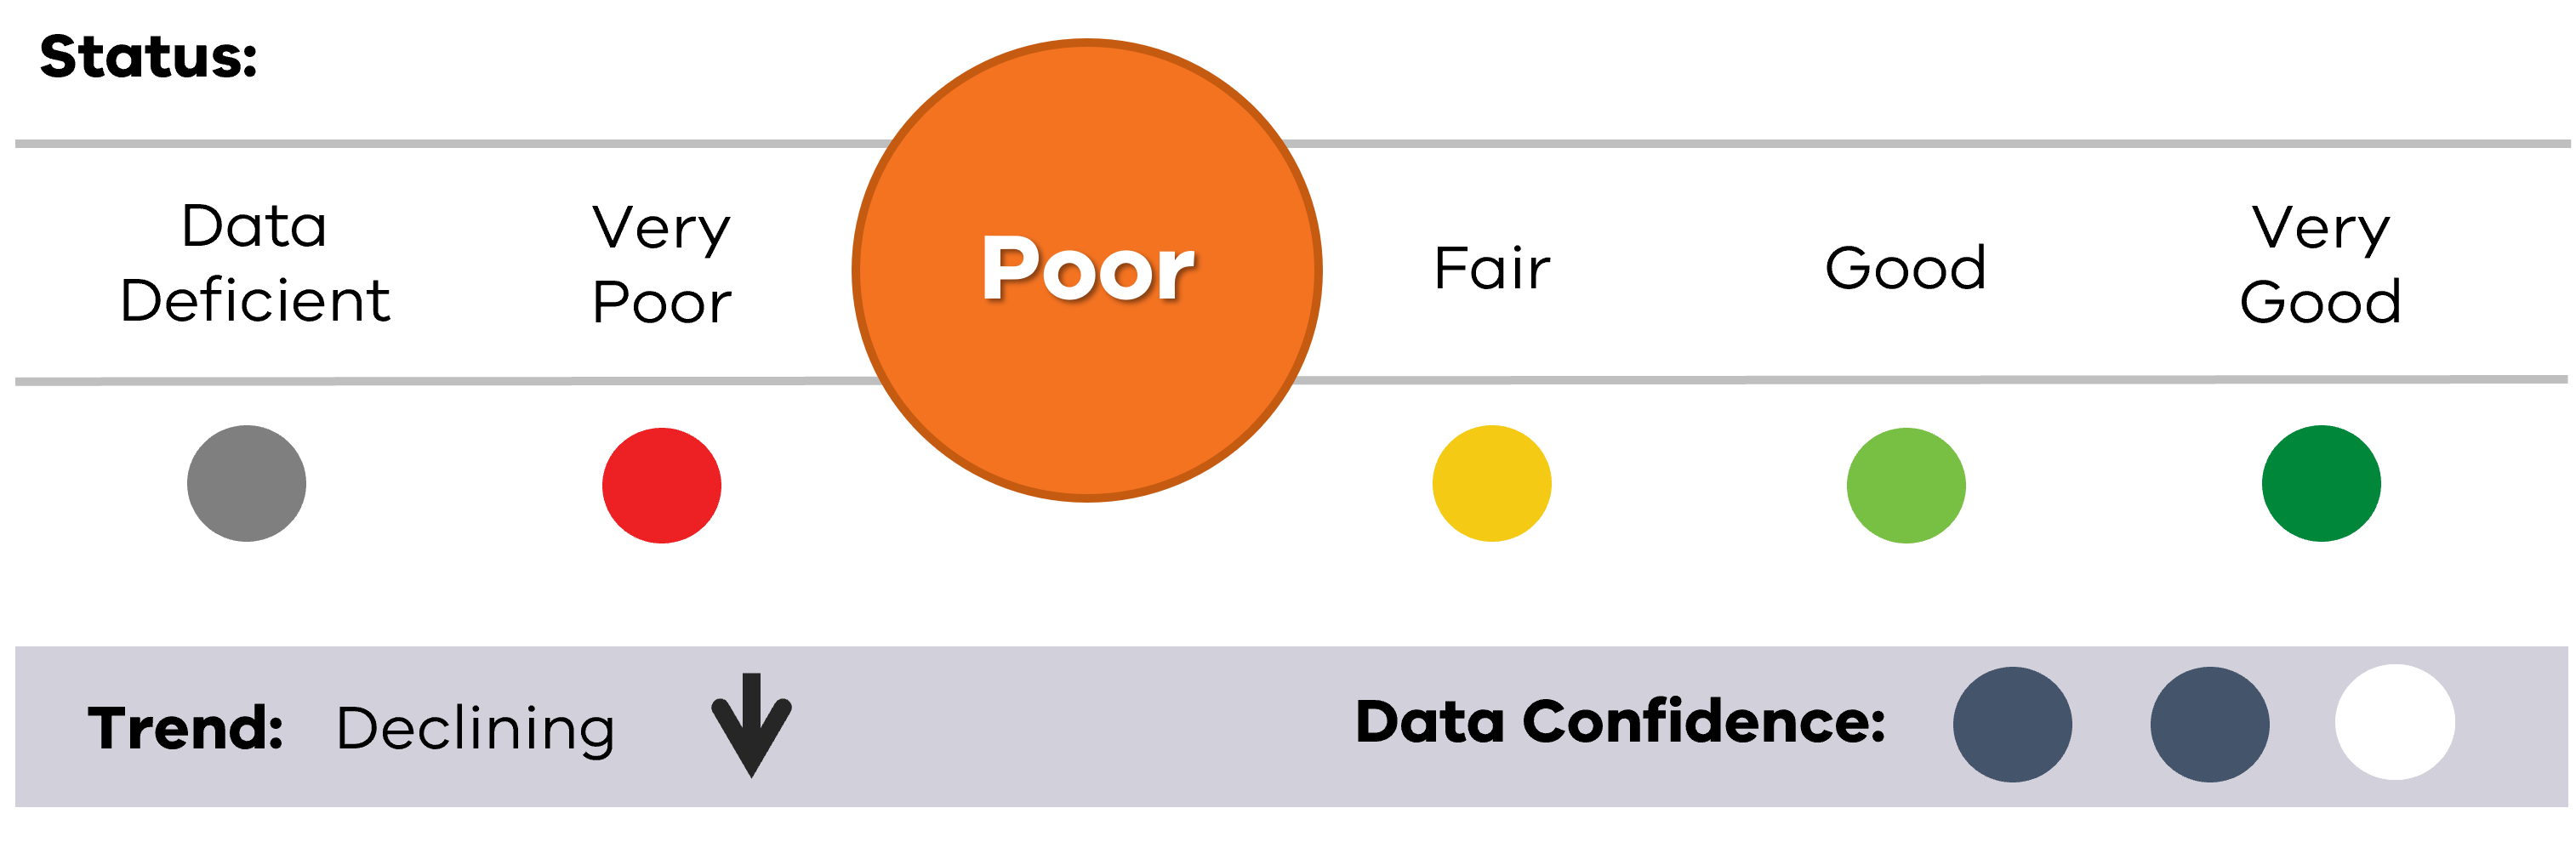
The Litter Index method was used to calculate the 2023-2024 results. The status is currently Poor with a Declining trend, after calculating the composition and density of litter around the Bay.
Data for this report has been sourced from LitterWatch Victoria. Surveys prior to the launch of LitterWatch in 2019 have been added to the system allowing us to calculate the status in 2017-18. Due to different numbers of surveys occurring across different years, a confidence assessment has been applied to the results to ensure that the reliability of the data is evaluated. Approximately 65% of LitterWatch surveys in the EMP catchment areas, occurred in the local government areas of City of Port Phillip, and Greater Geelong. Therefore, the results are more representative of those areas than other locations in and around Port Phillip Bay and the catchments.
Plastic currently accounts for 82% in surveys used to calculate the Litter Status, specifically with microplastics <5mm attributing to 16%. The Victorian Government implemented a key method to target plastic; the single-use plastic bag ban which started in 2019 and data will be examined as part of future reporting for declines in plastic bag litter.
For a more detailed view on how these results were determined, please view the methodology section.
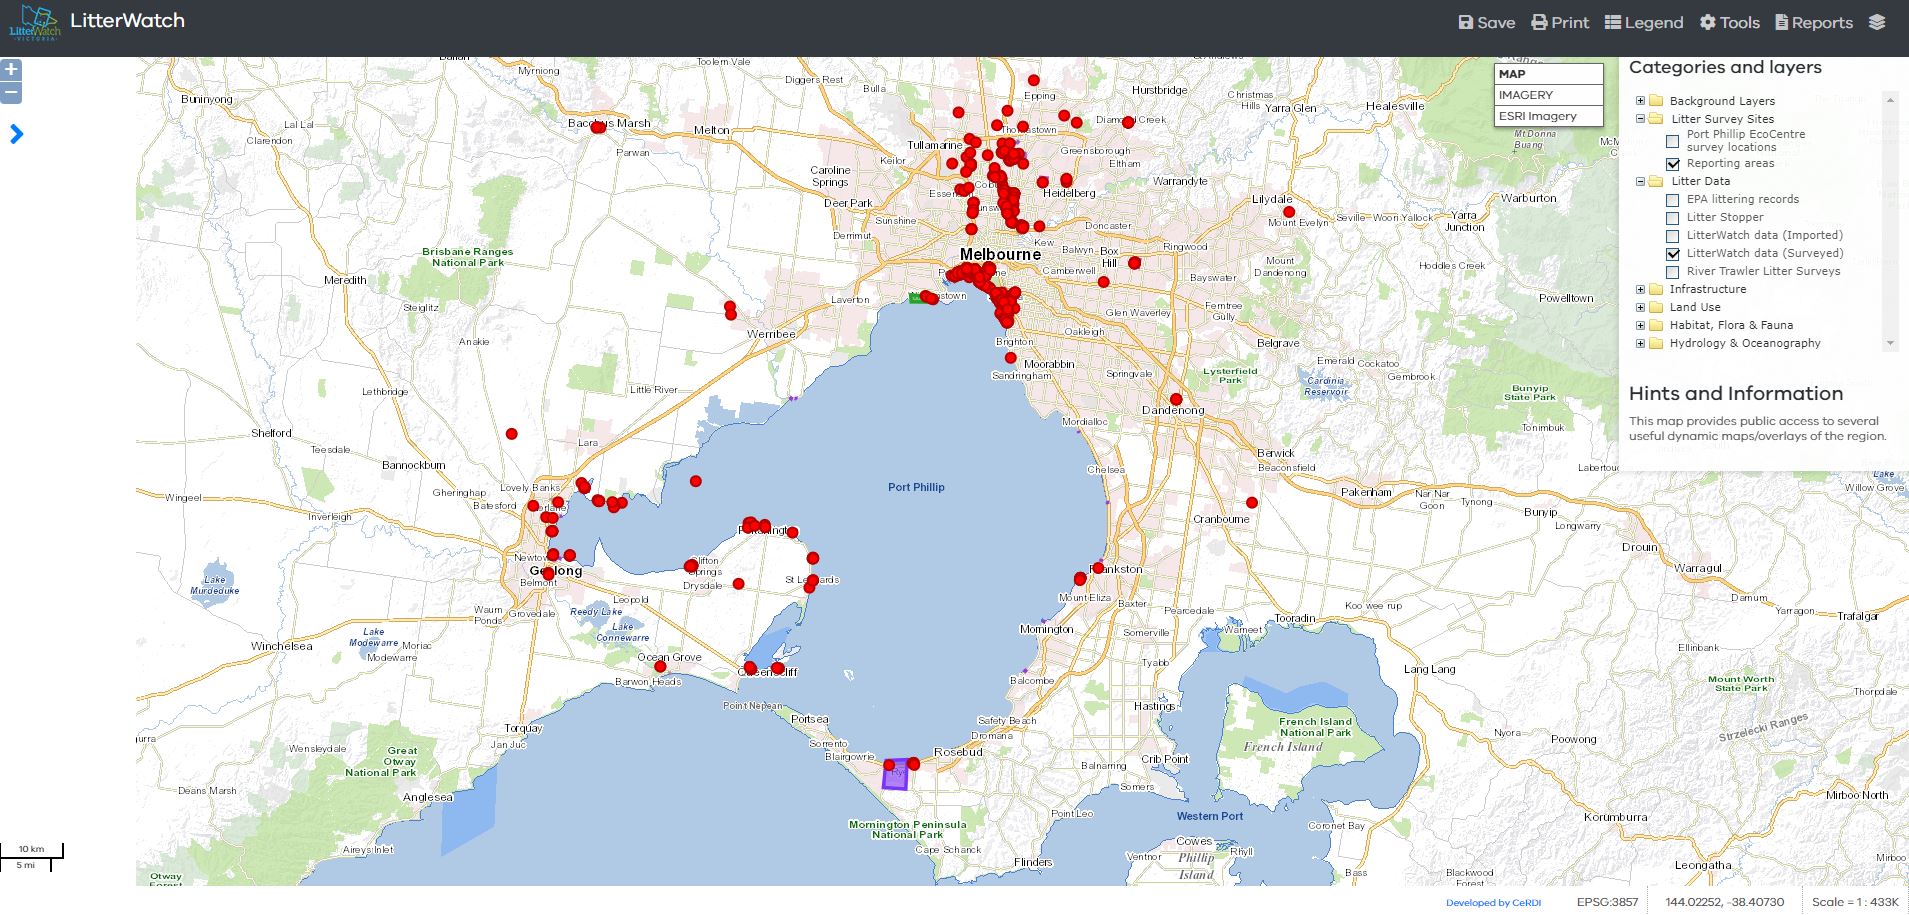
Explore more on the LitterWatch Portal
Data contributors and acknowledgements:

Page last updated: 30/10/25