The health and condition of Port Phillip Bay’s habitats and marine life is evaluated using the Marine Biodiversity Index (MBI). Indexes enable simplified reporting on complex information and are used worldwide for reporting on environmental condition and management actions. The MBI provides high-level evidence to highlight and direct future efforts towards priority areas of the marine ecosystem that are declining in health.
Integrated assessments are performed separately for Port Phillip Bay’s 7 key ecosystem components. Each ecosystem component has assessment biota (species or groups of species) assessed using specific indicators.
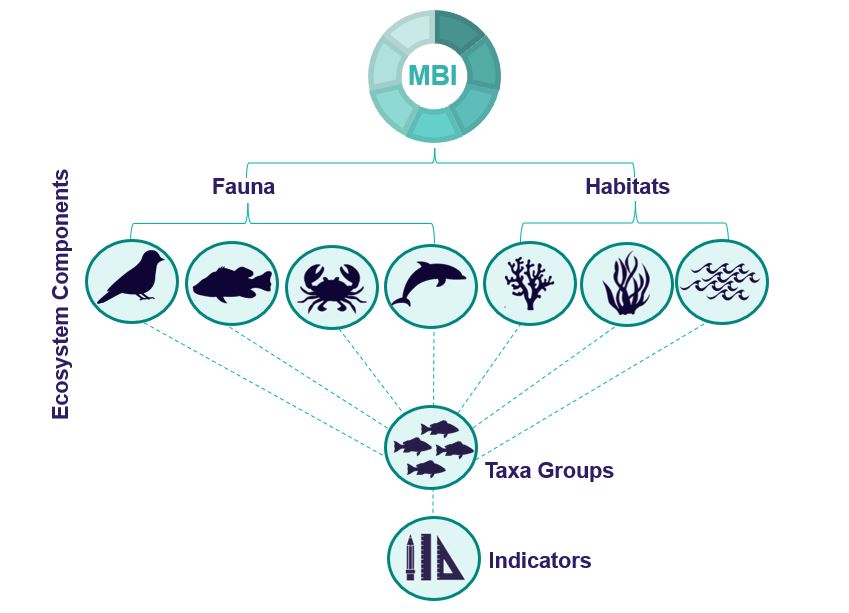
Stakeholders and experts have been consulted for each ecosystem component to provide data, exchange scientific knowledge, and assist in the development of threshold values specific for each indicator.
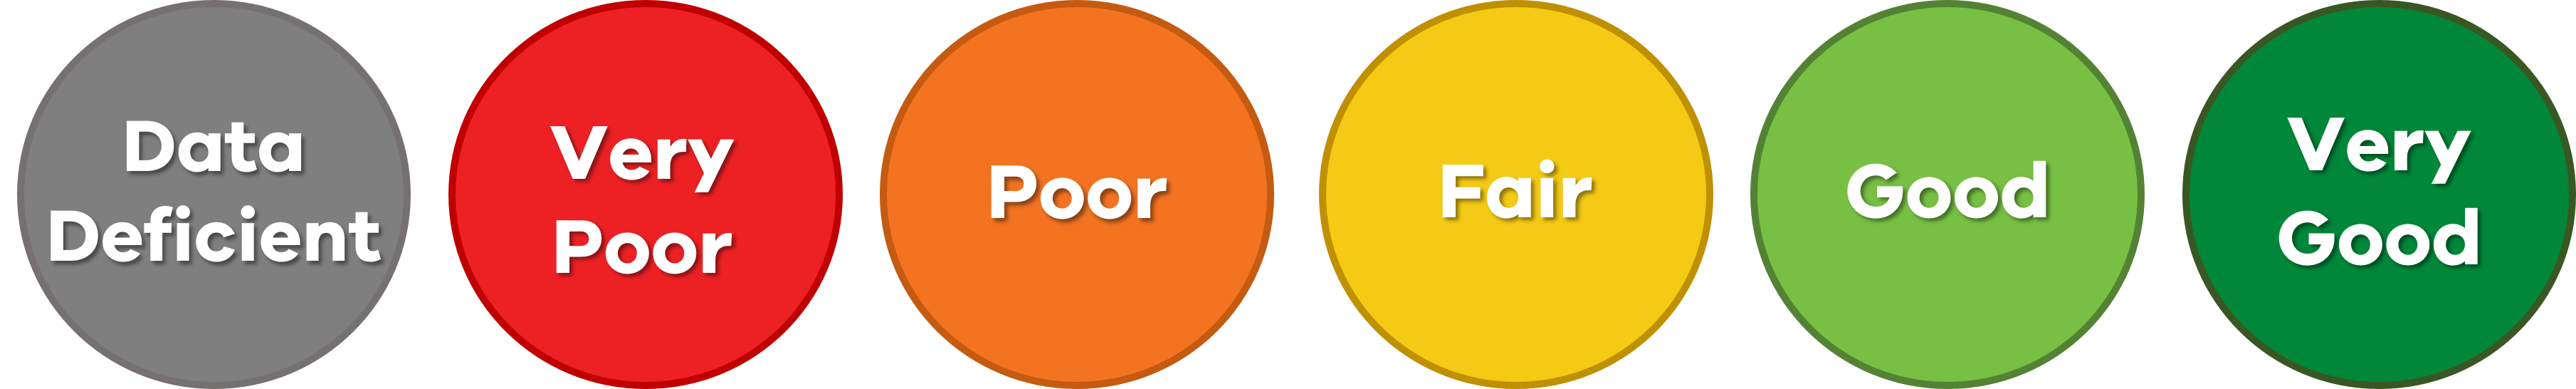
There are 5 status categories, with the progression from Very Poor through to Very Good, broadly representing increasing health, condition and resilience of habitats and marine life. These status categories are defined by indicators unique for individual assessment biota. Indicators are normalised to form a Biological Quality Ratio (BQR), providing a common scale to directly compare assessment biota, and to combine these values to calculate ecosystem component BQRs.
| Status | Description |
|---|---|
| Very Good | The maximum value, scores 80% to 100% for the BQR. |
| Good | At baseline or threshold defined by expert stakeholders, scores 60% to below 80% for the BQR. |
| Fair | Below baseline/threshold defined by expert stakeholders, scores 40% to below 60% for the BQR. |
| Poor | Below baseline or threshold defined by expert stakeholders, scores 20% to below 40% for the BQR. |
| Very Poor | The minimum value, scores 0 to below 20% for the BQR. |
| Data Deficient | Not enough data to define a status (indicator not assessed). |
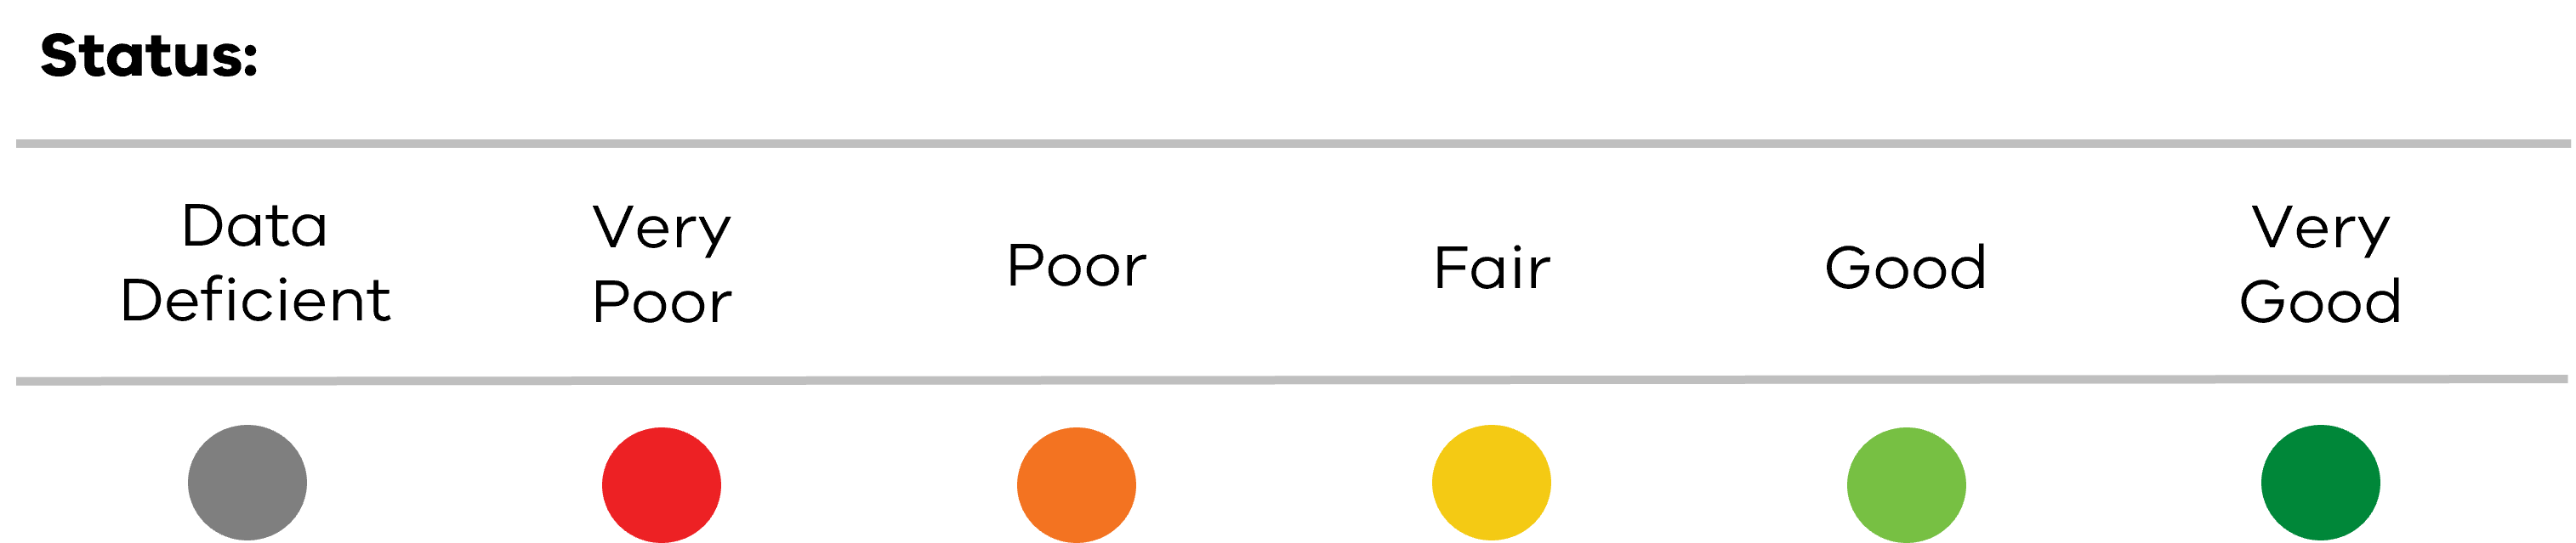
The status for assessment biota is shown as a status bar, with the status result shown inside a large circle in the relevant colour.
Each individual assessment biota and grouped ecosystem component has a data confidence score evaluating the underlying data the indicators are derived from, defined by stakeholder experts and calculated to produce a value between zero and one. Data confidence is calculated by combining the following 4 metrics:
- Accuracy of indicator results.
- Temporal coverage.
- Spatial representation.
- Methodological quality.
High, Medium and Low confidence scores are indicated using circles. One filled circle represents low confidence (a score of less than 0.5), 2 filled circles represents intermediate (a score of 0.5 to 0.75) and 3 filled circles represents high (a score greater than 0.75).

Trends are calculated from the difference in BQR status percentages between the current year and previous year. Trends will either be defined as Declining (a decline since previous year), Improving (a rise since previous year), or Stable (no change since previous year). This means a status can be the same for the current and previous year, but the trend is increasing or decreasing based on the BQR percentage.

Each ecosystem component uses different indicators appropriate for the assessment biota. As more data becomes available additional indicators may be included in the assessment.
Limitations are inherent in biological datasets. There are data gaps in survey methods, inconsistent monitoring across time and in some cases inconsistency in survey methods. Furthermore, the spatial aspect captured by surveys differs for different taxonomic groups and sometimes within a taxa group. The MBI approach aims to compile and standardise quantitative information, where possible, to support the assessment of the Bay’s biodiversity and report on its status. The MBI is limited in its ability to determine the reasons for declining status trends or sudden changes as well as appropriate management actions to apply for different taxa. Future expansion of the MBI to address specific management actions and questions may be possible with improved data on threats and ecosystem processes.
The full Marine Biodiversity Index report can be downloaded here.
Page last updated: 17/04/24