1. FeAST data inventory
The FeAST data inventory has been prepared by Dr. Matt Edmunds (Australian Marine Ecology), Dr. Adrian Flynn (Fathom Pacific) and Adam Nordinson (Nordinson Studios), and underpins the functioning of FeAST.
The FeAST data inventory is stored in a relational database in PostgreSQL and is displayed as views to retrieve data in the form of a query from multiple tables. Each activity, pressure, feature, and habitat has been assigned a code, id, and tier, and operates in a hierarchical way.
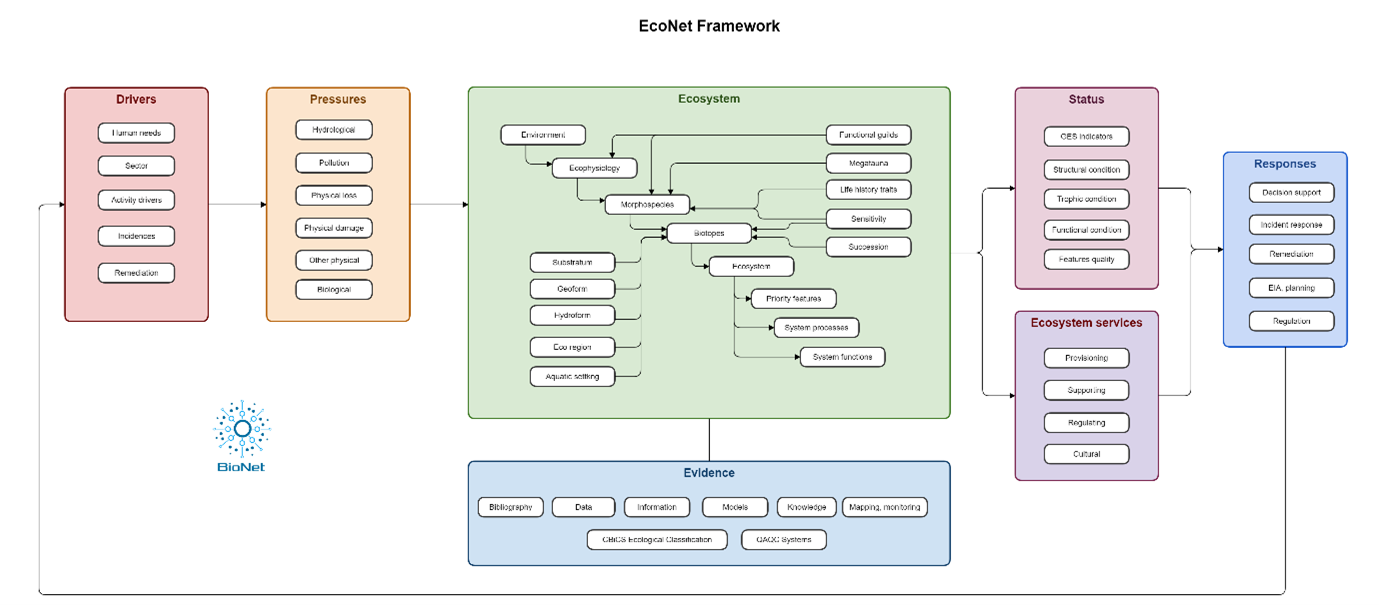
The structure of the database allows for multiple connections to be formed between these nodes, describing all possible impact pathways and the link strength or relationship as defined in terms of the sensitivity and intensity. This can be expressed as an ecosystem network model as referred to as EcoNet.
The schematic diagram below shows the structure of the EcoNet framework (Edmunds et al, 2022).
Scores for sensitivity and intensity are relative and have been assigned using a semi-quantitative approach, combining expert opinion with relevant literature. The confidence of scores and linkages have also been evaluated using a 3-tier system in the database, whereby the confidence is based on the weight of evidence available.
The EcoNet is fully spatialised for habitats and features, each node has been assigned a geometry in the database. This allows assessments to be site-specific using mapping available in CoastKit. The data in CoastKit is supported by a data management plan, ensuring data is frequently updated and reviewed under FAIR data principles.
2. Pressure Score
The Pressure score is the initial step in the FeAST risk assessment process to understand the potential effect that different human activities can exert on the environment.
This step primarily forms a screening process, where a user selects the activities relevant to the proposal and FeAST performs a pressure identification and prioritisation process. This involves the tool extracting only the pressures with a high and medium intensity, which then inform the next stages of the FeAST assessment.
The Marine Evidence-based Sensitivity Assessment (MarESA) developed by Marine Life Information Network (MarLIN) (United Kingdom) (Tyler-Walters et al, 2018 & 2022) and the Joint Nature Conservation Committee’s (JNCC) pressures-activities database (Robson et al, 2018) commissioned by Department for Environment, Food and Rural Affairs (United Kingdom) are methodologies that have principally guided the development of FeAST.
FeAST expands on the JNCC list of activities which incorporates all stages of a proposal from the pre-construction, construction, operation, to decommissioning. This aligns with efforts to adopt a life cycle assessment and encompass all possible ecological impact pathways. Each of the 12 activity categories broadly represent the human needs required by the various sectoral divisions. The FeAST data inventory captures 131 anthropogenic activities which are listed alphabetically in with summarised descriptions.
It is recommended that users consult the activity definition tables (see Supporting information) to ensure the activities selected in the tool best describe the use, development or works proposed. It is common for one proposal to have multiple activities, for example to deploy, build, or demolish a structure. Therefore, it is important that all primary and secondary activities are selected to provide an accurate measure of risk to ecological values.
The list of activities represents those most frequently conducted in Victorian waters and other industries that may emerge in the future under the blue economy. However, the list is not exhaustive, and it is possible that some activities may be absent from the tool. The activities listed also range in scale, some activities may have a small impact and not require any form of planning consent.
Activities can have multiple negative, positive, and benign effects on ecological values and the environment which are captured by the pressures exerted. Each activity in the FeAST data inventory has been assigned all relevant pressures and an intensity profile. The table below shows the intensity profile for pressures.
| Intensity | Potential ecological effect | Considered in the FeAST assessment |
|---|---|---|
| High | Ecosystem functional change | Included in the FeAST assessment, with the highest score across all activities used as the Pressure score |
| Medium | Populations and communities will shift a distinct level | |
| Low | Some noticeable change | Excluded from the FeAST assessment |
| NA | Not applicable |
The nature of the relationship between the activity and pressure is referred to as the intensity or intensity profile, which represents the potential effect to the ecosystem resulting in anything from an ecosystem functional change to negligible effect. The Pressure scores are based on evidence derived from a suite of benchmarks and thresholds, which have been developed through expert consultation workshops.
A full list of pressures evaluated by FeAST with descriptions and benchmark values can be found under Supporting information.
This analysis builds on the substantial work conducted in Europe initially by OSPAR Intercessional Correspondence Group on Cumulative Effects in 2011 to develop a standardised list of man-made marine pressures (Connor et al, 2011), which was later updated by NatureScot in 2020 to provide clear definitions and impact benchmarks for use in Scotland’s Marine Assessment in 2020.
These benchmarks have subsequently been adapted for a Victorian context and adjusted using indicators and objective values obtained from state-wide documentation such as the Environment Reference Standards and other best-practice guidelines.
The pressures considered in FeAST only include anthropogenically direct pressures, therefore excluding indirect pressures such as the effects of greenhouse gas emissions, climate change and ocean acidification. The intensity of pressures is evaluated without considering the location of the defined project area, different locations may need to consider location specific values for environmental parameters such as pollutants or nutrient concentrations. The FeAST assessment has applied a precautionary approach to determining intensity baselines.
To calculate the Pressure score when multiple activities are selected, the assigned pressures are combined in a table and the highest (or worst) intensity level achieved across the activities is adopted as the Pressure score. Each pressure is assessed separately and does not account for the cumulative impact that multiple activities may have on the marine and coastal environment. Further assessment would be needed to establish the cumulative effect the interactions between different activities such as the additive, synergistic and antagonistic impacts.
The FeAST risk assessment has adopted a pressure-based approach to assist with identifying the key ecological impact pathways from activities for the basis developing mitigation and management measures. The relative scoring ensures that each activity is assessed in a standardised way, the ranking is comparable among activities and allows for applications such as an options analysis (see FeAST user guide page).
3. Habitat score
The next step of the FeAST risk assessment involves assessing the sensitivity of each habitat within the defined project area to each of the screened pressures. The tool conducts a spatial analysis to identify which habitats are found within the defined project area using the most up-to-date habitat maps for Victoria. Sensitivity assessments are undertaken at biotope level 3 classifications (Habitat Complex).
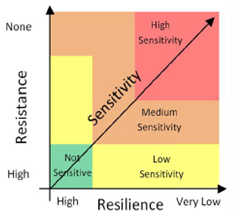
Sensitivity can be defined as the function of the habitat to withstand or tolerate change as exerted by a pressure referred to as resistance against the rate of recovery after impact or inherent adaptive capacity to return to its prior condition which is referred to as resilience (Tillin & Tyler-Walters, 2014). The development of the methodology for the Habitat score has been adapted from MarESA.
The likelihood of functional change due to a pressure is factored into the scoring of sensitivity. To calculate the sensitivity for each habitat against each itemised pressure, the resistance and resilience have been scored from high to very low based on a review of available scientific evidence and literature by Australian Marine Ecology (AME). The lower the score achieved across both categories means that the response is poorer and hence demonstrates that the severity of the impact to the habitat is greater.
The descriptions for the assessment scales of resistance and resilience are provided below and have been adapted from the MarESA approach.
| Resistance | Description |
|---|---|
| None | Key functional, structural, characterizing species severely decline and/or physicochemical parameters are also affected e.g. removal of habitats causing a change in habitats type. A severe decline/reduction relates to the loss of 75% of the extent, density or abundance of the selected species or habitat component e.g. loss of 75% substratum (where this can be sensibly applied). |
| Low | Significant mortality of key and characterizing species with some effects on the physicochemical character of habitat. A significant decline/reduction relates to the loss of 25-75% of the extent, density, or abundance of the selected species or habitat component e.g. loss of 25-75% of the substratum. |
| Medium | Some mortality of species (can be significant where these are not keystone structural/functional and characterising species) without change to habitats relates to the loss <25% of the species or habitat component. |
| High | No significant effects on the physicochemical character of habitat and no effect on population viability of key/characterising species but may affect feeding, respiration, and reproduction rates. |
| Resilience | Description |
|---|---|
| Very low | Negligible or prolonged recovery possible; at least 25 years to recover structure and function. |
| Low | Full recovery within 10-25 years. |
| Medium | Full recovery within 2-10 years. |
| High | Full recovery within 2 years. |
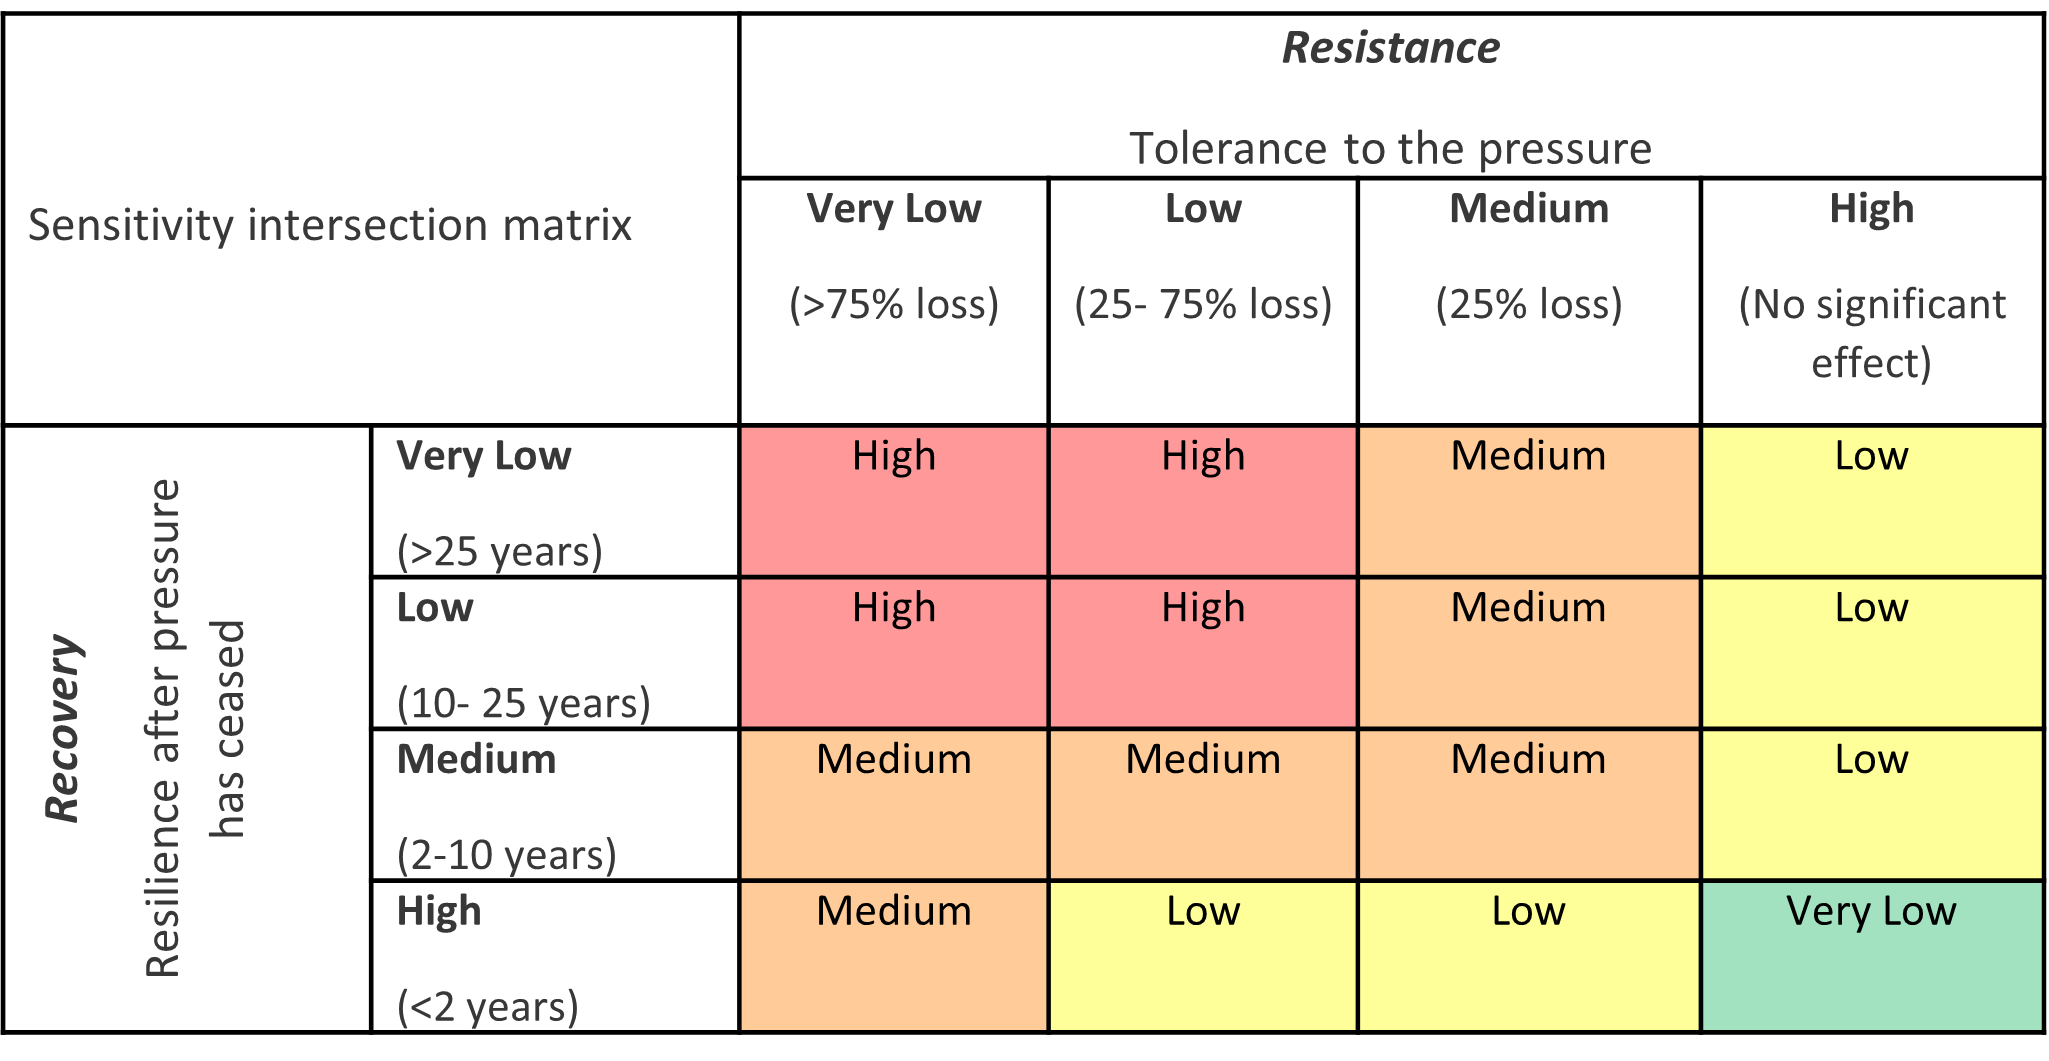
The scores obtained for resistance and resilience per habitat to each pressure are combined to produce the sensitivity score using the matrix below. A linear relationship is expressed between resistance and recovery, where if low scores are achieved in both assessments, the sensitivity will be higher for that specific habitat type against the pressures.
To calculate the Habitat score, each sensitivity score is assigned a number from 1 – 5, this denotes the degree of sensitivity from very low to high. The Habitat score is calculated, for each habitat type, by adding together the sensitivity scores across all applicable pressures using a standardised normalisation process as shown in the example below. This value is then converted to a percentage score which is categorised using pre-determined thresholds.
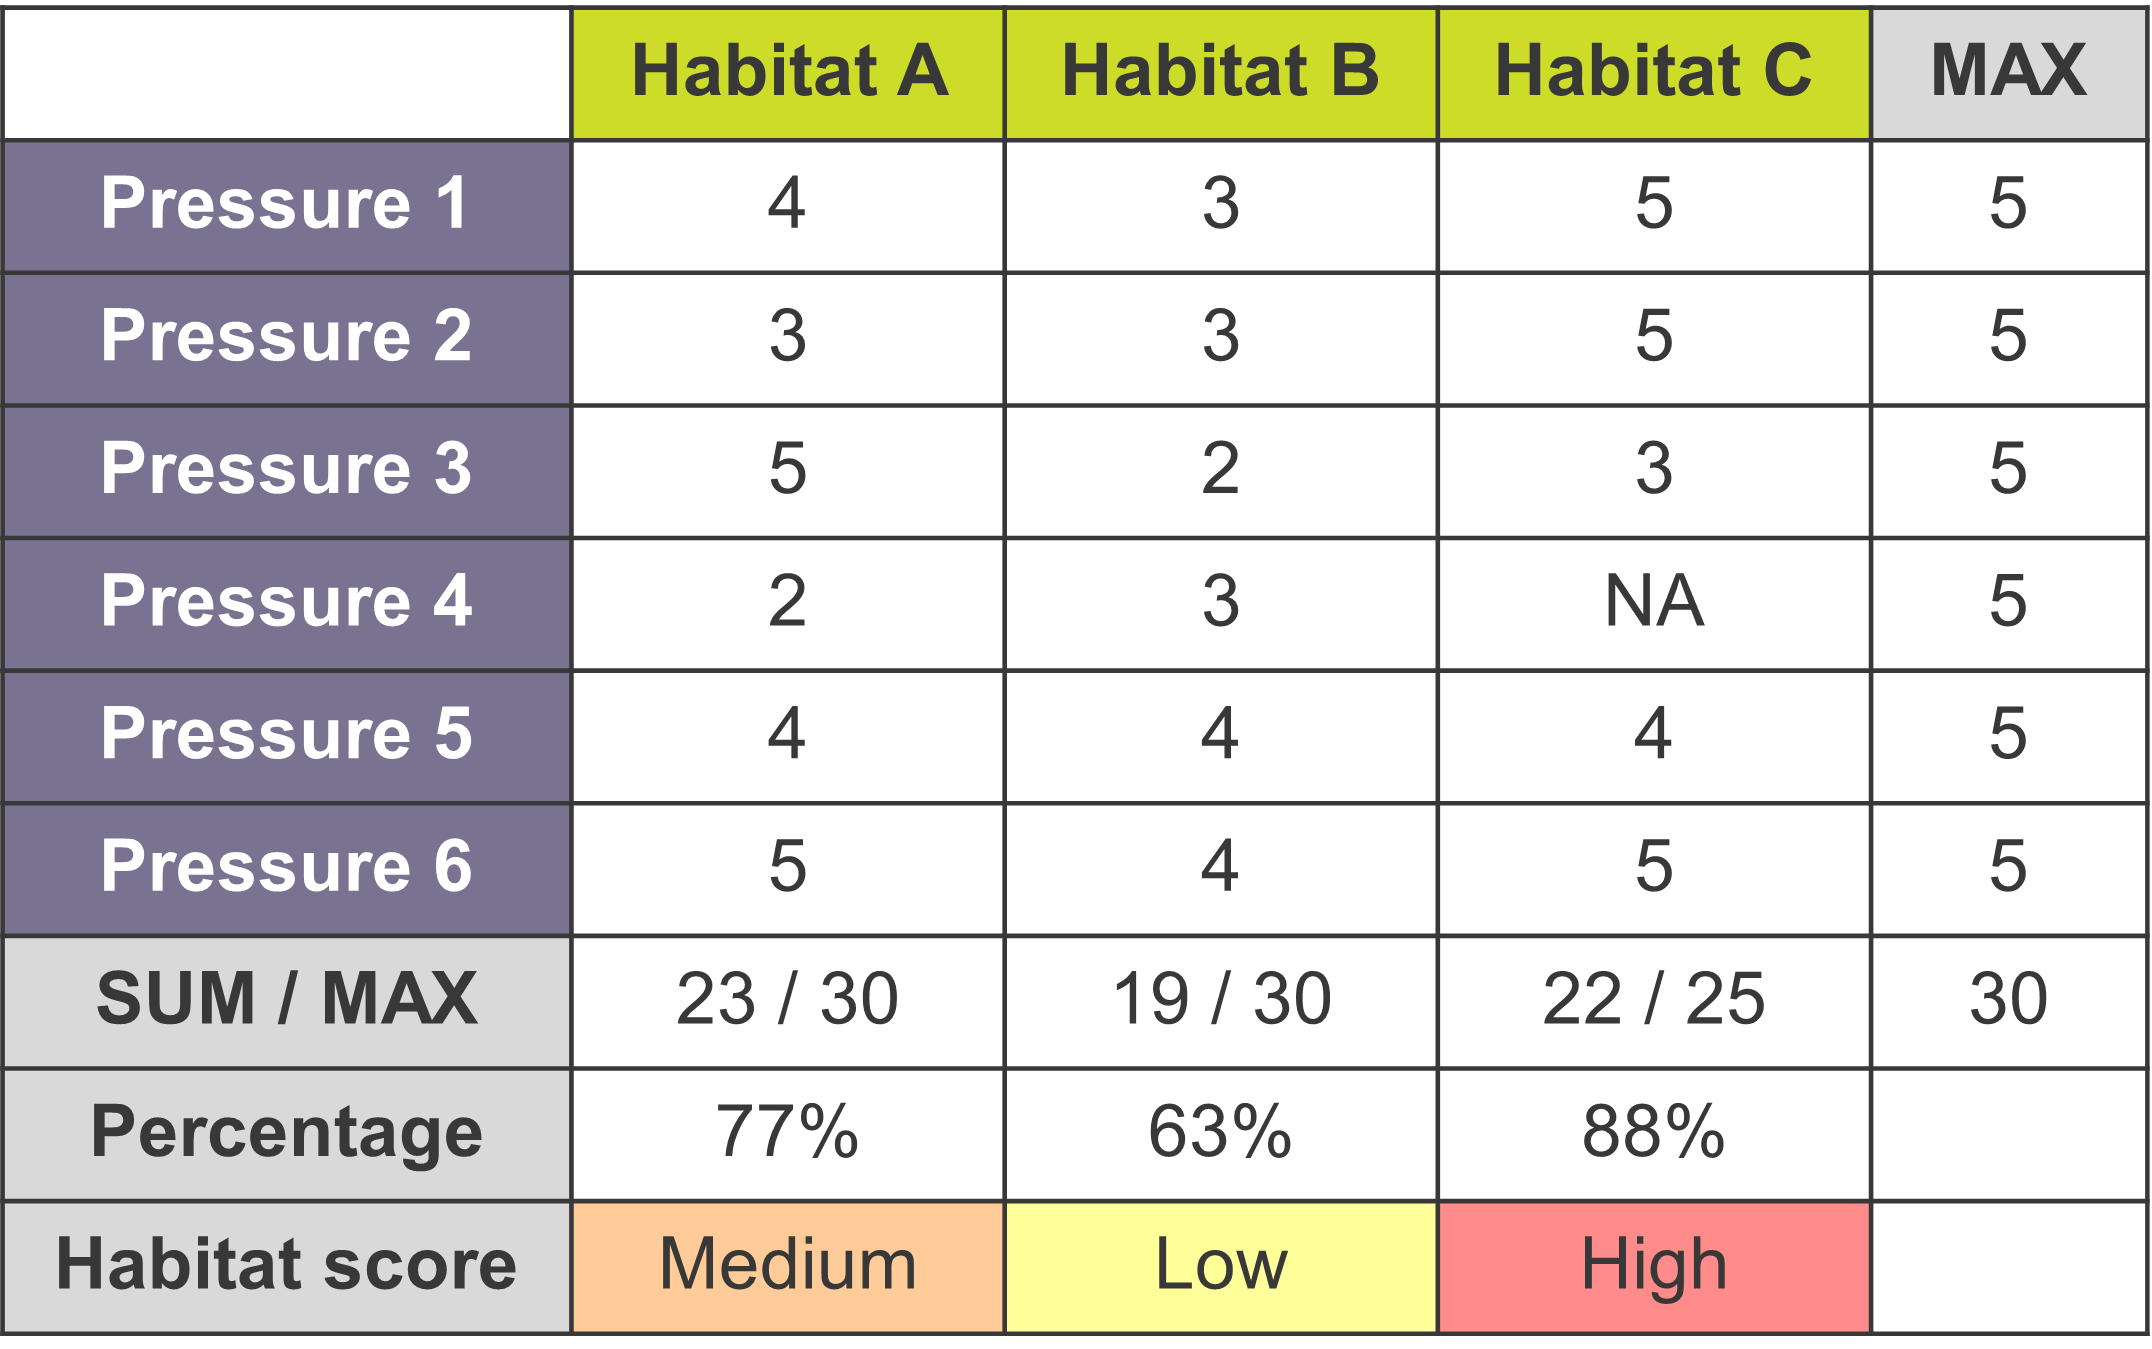
To calculate the Habitat score, the sensitivity scores achieved for each habitat per applicable pressures are summed. To normalise these values, the maximum total sensitivity score attainable per pressure, which is always 5 (or high), is used. The sum is divided by the max and multiplied by 100 to form a percentage score.
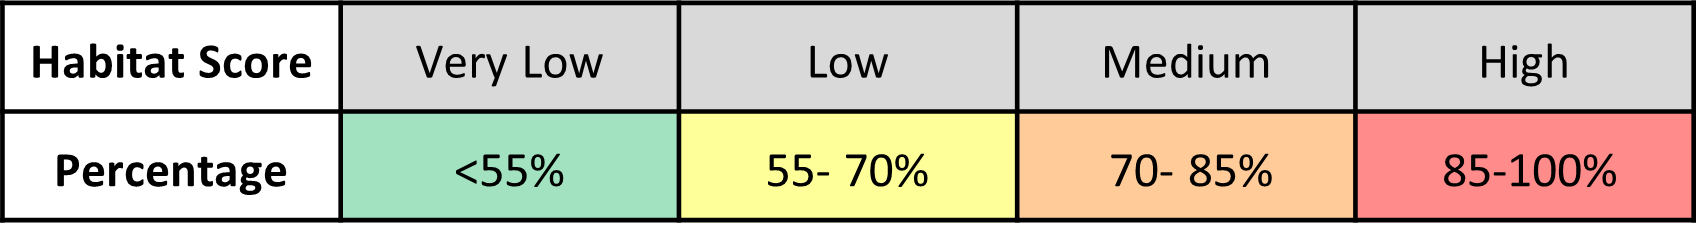
The calculated percentage scores are categorised into four levels of Habitat scores as shown below. The Habitat score can be interpreted as the total sensitivity to all the activities selected or pressures identified in the FeAST assessment, without taking into account any cumulative effects.
The Habitat score step in the FeAST assessment considers the general sensitivity of the habitat types and several limitations apply as shown below. In cases where additional information exists or can be collected through surveys, it is the responsibility of the user to ensure that local properties of habitats are accounted for.
The Habitat score does not consider the extent of the habitat area, level of exposure or location. Habitats in specific locations may have diverging life history traits or intrinsic properties from the typical habitat considered in the FeAST assessment. Differences in behaviour, structure, growth, morphology or habitat connectivity may result in changes in resilience and resistance to specific pressures.
4. FeAST score
The FeAST score depicts the final risk score of the proposal to each of the identified habitats. This score establishes the level of risk by assessing the vulnerability of the habitat to determine the degree of exposure.
To do this, the tool conducts a spatial analysis to estimate the overlap of the defined project area with each habitat. This analysis factors in an estimation of the distinctiveness or significance of each habitat which is considered in the context of the 26 marine biounits in Victoria (see Supporting information).
The biounit boundaries have been employed as a metric for estimating the distinctiveness of habitats and hence the total habitat area per biounit. This relies on the principle that habitats are area-based and regionally distinct due to their surrounding environmental conditions. Where each discrete biounit is characterised by differing physiographic settings, ecosystem processes and biotope distributions.
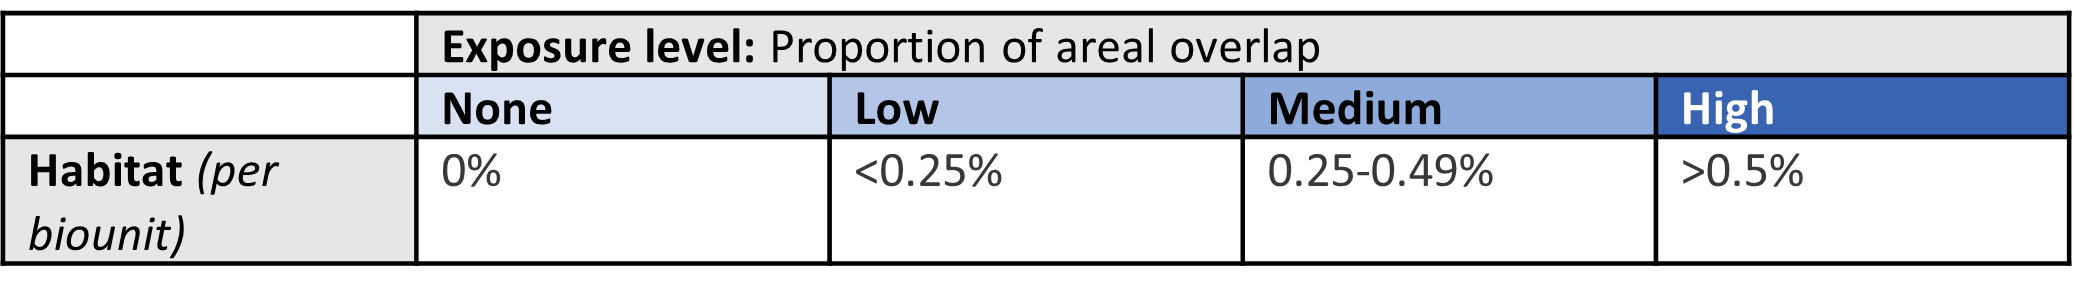
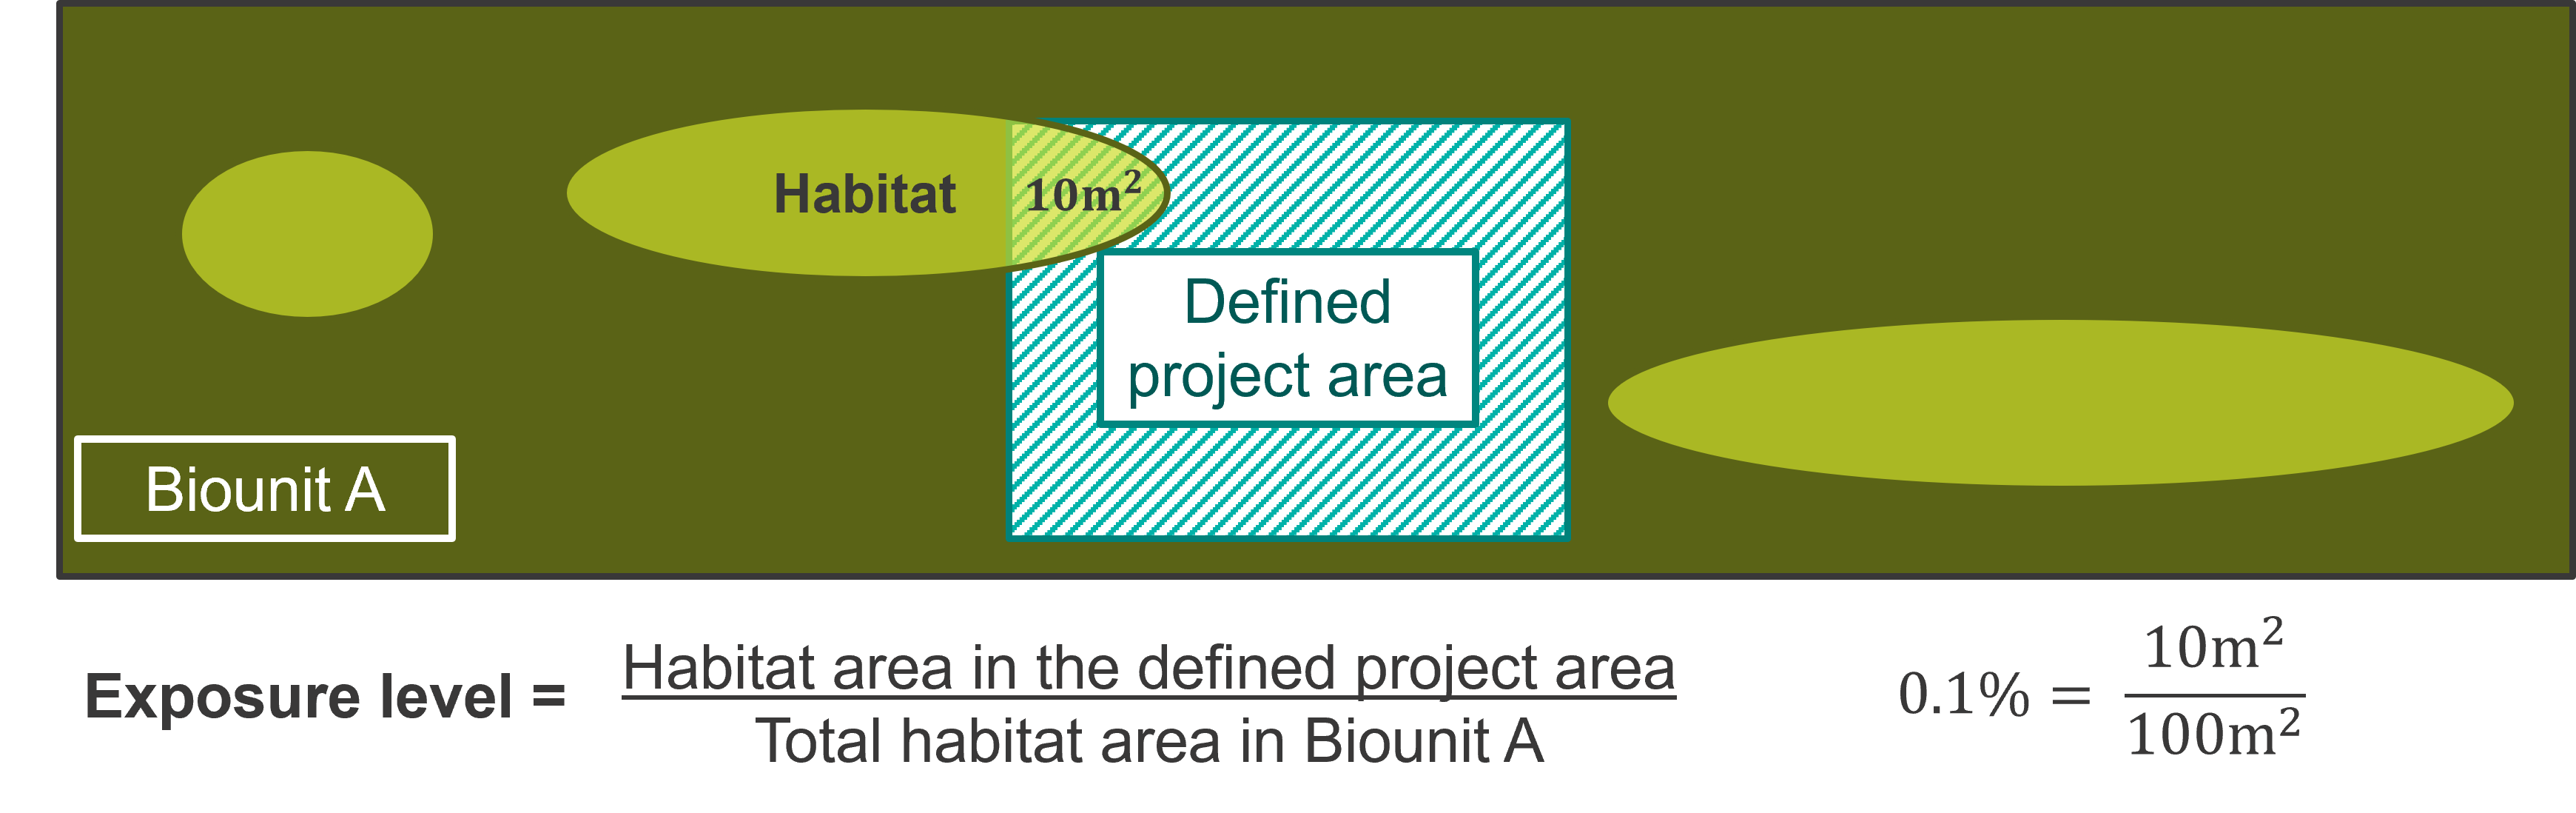
This is referred to as the exposure level and is ranked into high, medium, low and none categories based on the proportional of habitat area impacted, as shown in the table below. This is calculated by dividing the habitat area in the defined project area by the total habitat area in the biounit, as shown in the diagram. This produces a percentage score for each habitat per biounit.
The methodology for establishing the exposure level and the percentage threshold categories is based on research undertaken by Department of Environment Food and Rural Affairs UK (Griffiths et al, 2017). This is aligned with national and state policy targets to minimise the loss of habitats and declines of biodiversity under the Protecting Victoria's Environment - Biodiversity 2037 to protect Victoria’s environment.
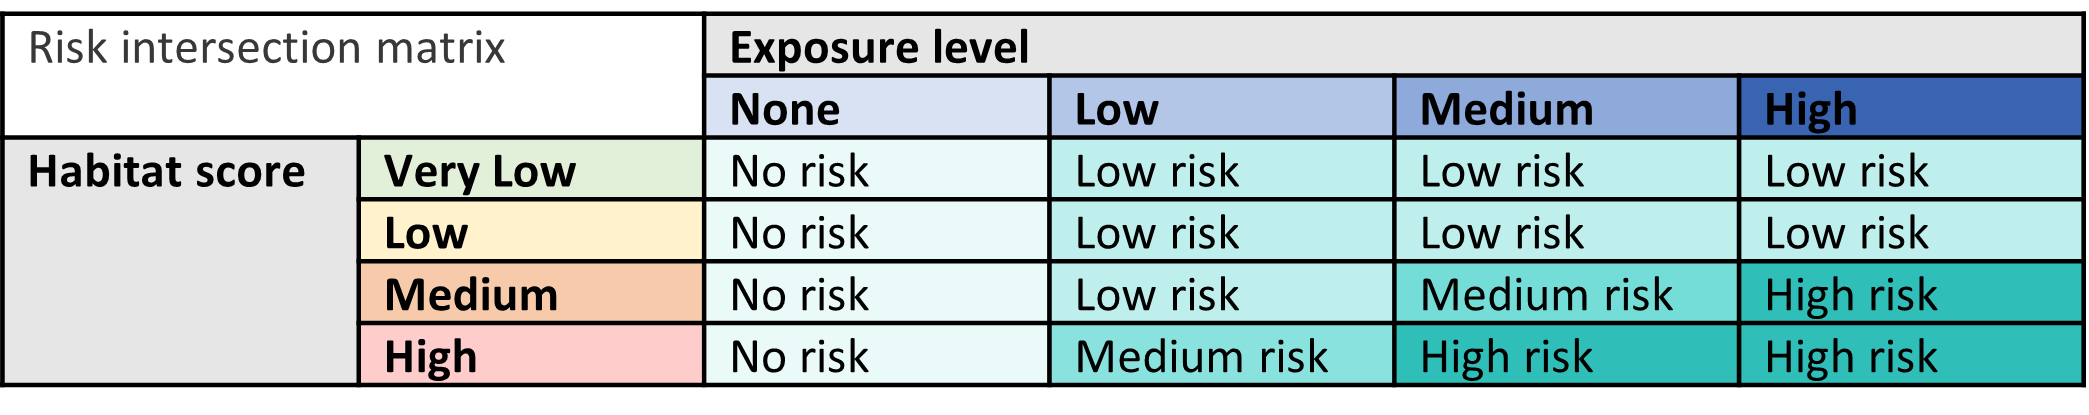
Following the calculation of exposure, the habitat score combined with the exposure level provides the overall risk level (FeAST score) for each habitat using the risk intersection matrix. This is shown in the table below.
The significance of the habitat type is also not factored into the calculation of exposure level or the FeAST score. The exposure level is based on the spatial distribution, where a habitat which is more widespread in a biounit will generate a lower exposure level regardless of the habitat’s functional or structural characteristics, or conservation status. There are several limitations that also apply, for more information please refer to the Introduction to FeAST page.
The FeAST score does not factor in the existing condition, quality, or connectivity of habitats.
The exposure level does not account for different three-dimensional interactions in the water column, i.e. where an activity may only occur in a benthic, pelagic, or surface setting. All activities will have the same areal overlap regardless of positioning.
Additionally the duration and frequency of activities is not incorporated into the analysis.
Page last updated: 08/05/23