The health of Port Phillip Bay and the state of litter and its impact on the Bay is evaluated using the Litter Index. The Litter Index provides an evaluation methodology for a litter priority area that can be used for reporting and to drive continuous improvement.
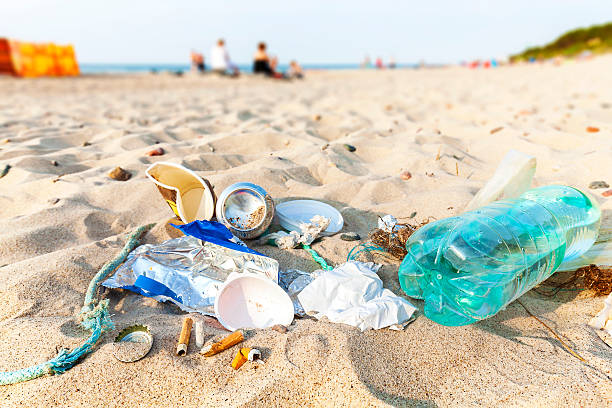
The Litter Index is based on 5 categories of status. The progression of status from Very Poor to Very Good broadly represents a decrease in litter in the assessment area. The Litter Index combines weighted component indicators to produce a score based on a scale of 5 gradient categories to evaluate the status of litter in Port Phillip Bay. The Litter Index will be calculated on a financial year basis for zones with sufficient data.
First, data from various litter-related survey initiatives and projects are used to calculate the 4 component Litter Index indicators: density, composition, amount ingested and entanglements. Data are standardised for survey effort and represent information for indicators for a single survey location per year. Each indicator is then allocated to a category based on that indicator’s unique threshold values. Thresholds were determined through expert elicitation via online survey and feedback and supporting peer-reviewed literature.
The first equation is used to standardise each of the 4 indicators by calculating an individual indicator score for each survey site based on the assigned category and associated score. Indicator scores are therefore comparable on a resulting 0-1 scale. As there is currently minimal data available for 'Marine Species Impact' around Port Phillip Bay and no monitoring programs currently exist within the Bay, thresholds are yet to be set for the 2 indicators within this category.
| Status | Description | |||
|---|---|---|---|---|
| Litter Profile | Marine Species Impacts | |||
| Density | Composition | Amount Ingested | Entanglements/Injury | |
| Very Good | <1 items/200m2 | <10% plastic | * | * |
| Good | 1 items/200m2 - 2 items/200m2 | 10% - 20% plastic/polystyrene | * | * |
| Fair | 2 items/200m2 - 100 items/200m2 | 20% - 40% plastic/polystyrene | * | * |
| Poor | 100 items/200m2 - 200 items/200m2 | 40% - 60% plastic/polystyrene | * | * |
| Very Poor | > 200 items/200m2 | > 60% plastic/polystyrene | * | * |
*Thresholds yet to be set for indicator
All 4 indicator scores are processed using equation 2. This calculation weights the litter profile assessment area more strongly (0.6 weighting) than the impact on wildlife assessment area (0.4 weighting), based on expert feedback and the lack of robust data in the impact on wildlife assessment area. For each indicator, the median of all Indicator Score values across all survey sites are calculated to represent the overall current state of that indicator in Port Phillip Bay.
The Litter Index Score can also be calculated if data for a particular indicator is absent (zero values would be applied). Equation 2 works by comparing the current state of Port Phillip Bay’s litter/litter-related impacts against the best-case scenario of minimal litter and litter-related impacts around Port Phillip Bay (i.e. a Very Good status of 1). The equation combines all 4 Indicator Scores (median values) across all survey sites per year to provide the overall Litter Index Score. The final Litter Index score is then assigned a Litter Index status.
| Overall Litter Index | |
|---|---|
| Litter Index Status | Litter Index Score |
| Very Good | 0.8-1 |
| Good | 0.6-0.79 |
| Fair | 0.4-0.59 |
| Poor | 0.2-0.39 |
| Very Poor | 0-0.19 |
Note that Very Good status threshold values do not reflect a pristine system: threshold values for all indicators are quantitative, and these values have been assigned to relate to realistic litter levels. It could be assumed that the ideal environmental state regarding litter would be pristine, meaning no litter or litter-related impacts are occurring in Port Philip Bay. However, achieving a pristine state is challenging for two reasons: firstly, litter, particularly plastic, is very pervasive and significant work is needed to remove litter already in the environment; and secondly, it would require design of a perfect system where no accidental losses occur as well as sufficient engagement for no intentional litter to occur. As this is not feasible, Very Good status relates to ambitious goals of avoiding polluted environments, rather than a pristine state.
There is currently no single, cohesive method for litter surveying in Victoria so the Litter Index needs to account for different surveying techniques. Therefore, the Litter Index requires a confidence assessment that quantitatively evaluates the reliability of the data. Confidence categories for litter datasets for the current indicators were determined through a combination of research and expert elicitation. Confidence categories (High, Medium and Low) consider data categorisation, temporal and spatial spread of data, and survey design (see the report for full details) .

The current results for each indicator by the most recent financial year, will be displayed using as a status bar with the status show circled in the relevant colour.
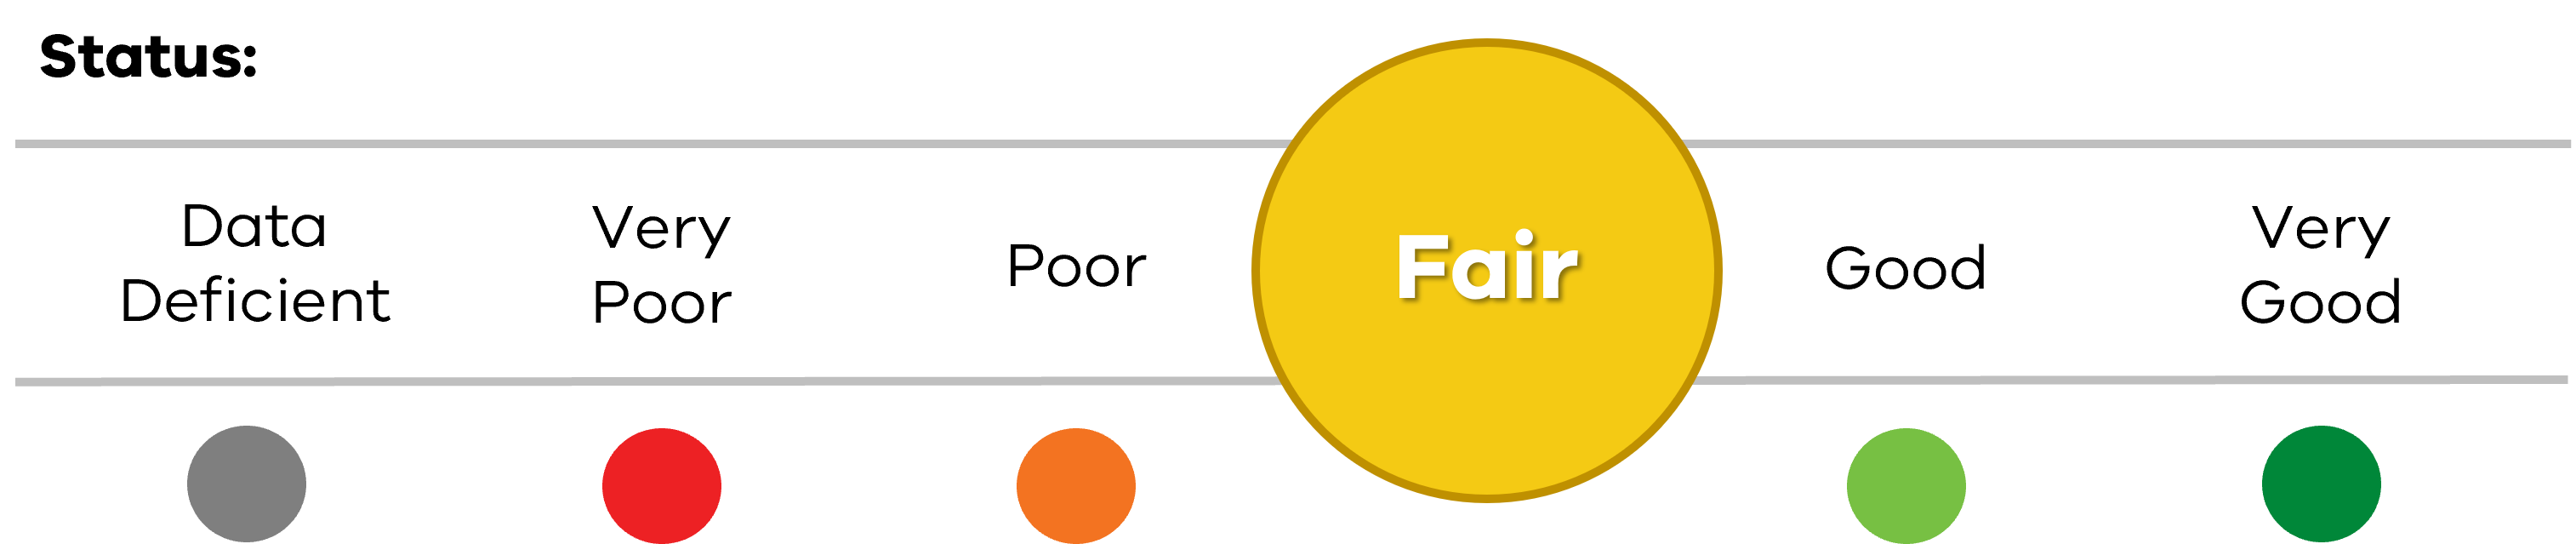
The trend is determined by the change in status from the previous reporting period, either improving, declining or staying stable. The ratios and scores may improve or decline within a status category, but the trend only measures change in status.

Page last updated: 11/11/24