The user guide will walk through an example case study for a fictional development proposal located in Corner Inlet. The case study will be used to demonstrate the applications of FeAST, featuring screenshots from the tool and FeAST assessment report. The example does not represent a real-life proposal or the approval process undertaken.
1. Where to access FeAST
The tool is publicly available on CoastKit, Victoria’s marine and coastal knowledge management system and online mapping portal. The tool works best with the latest browser version of Google Chrome.
To find out more about CoastKit check out the how-to video series.
After launching CoastKit, a navigation menu along the top bar with different tabs will appear.
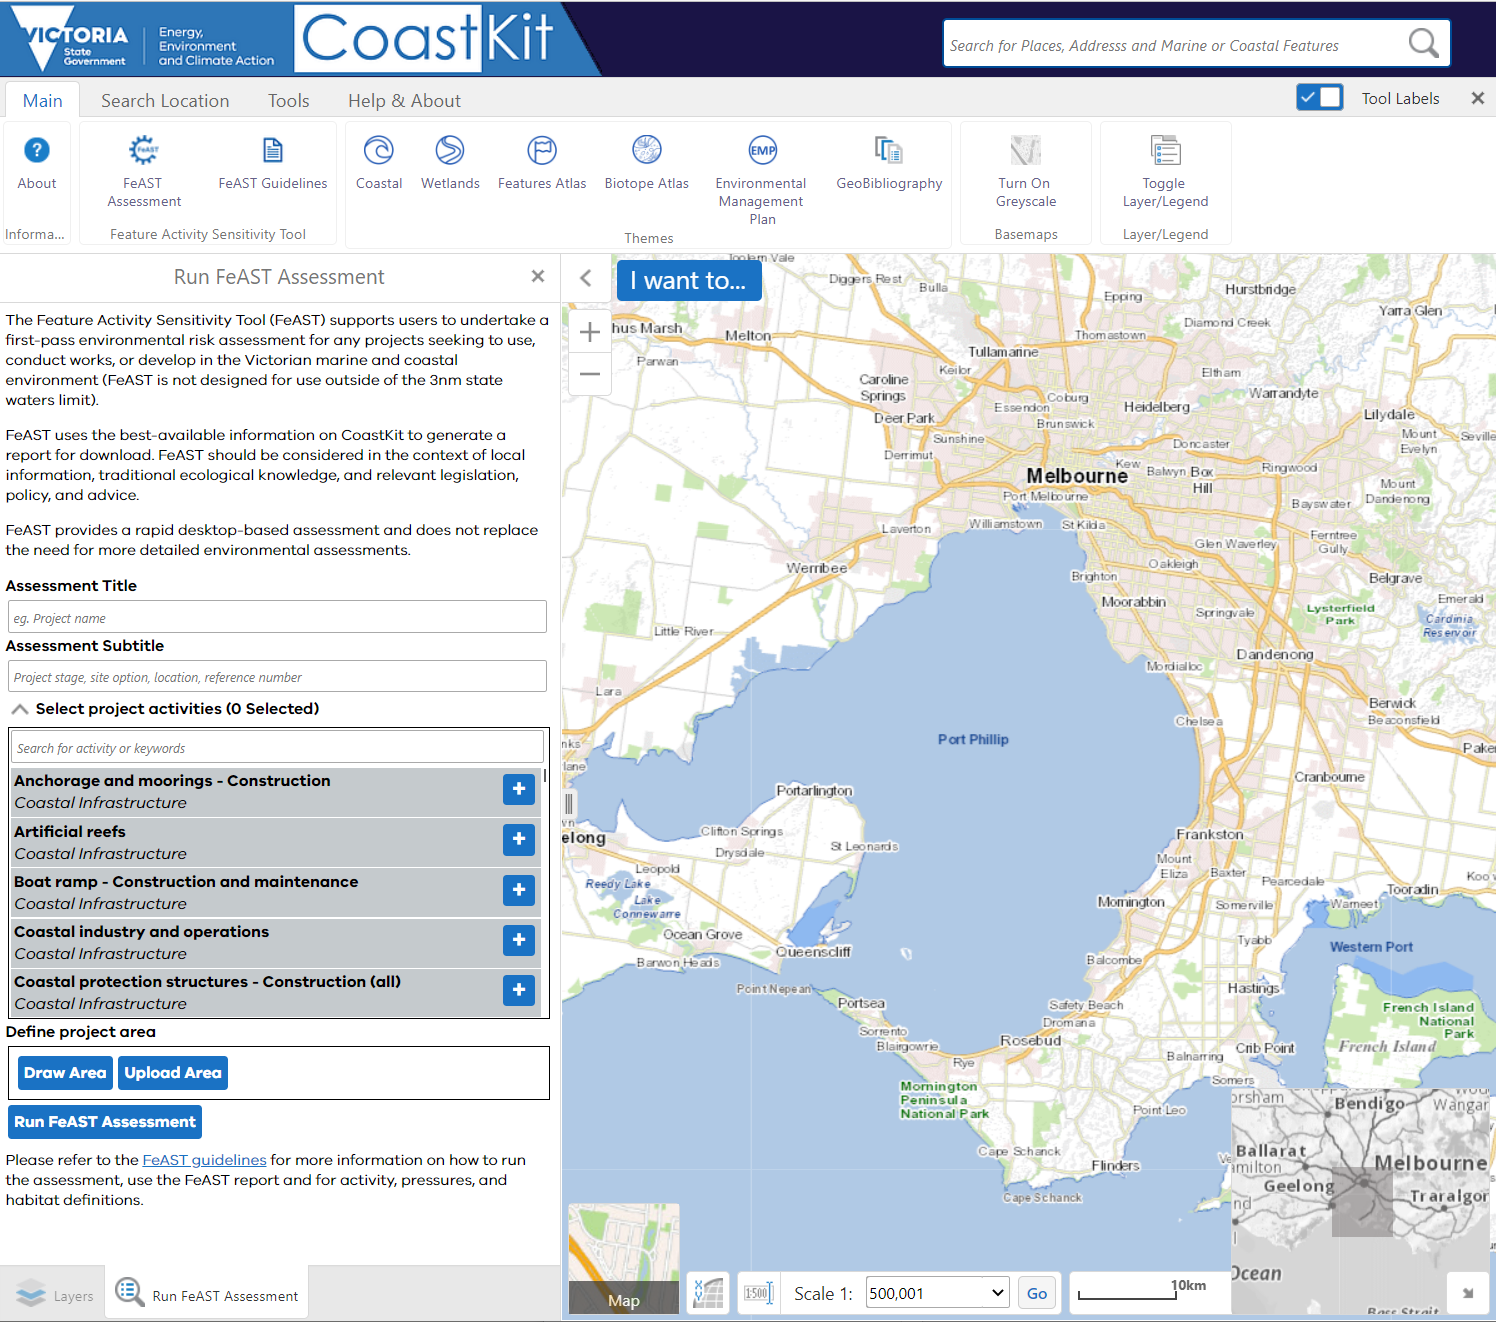
FeAST is located under both the Main tab and the Tools tab. When you click the FeAST Assessment icon, the left-hand side panel will change from Layers to Run FeAST Assessment, as shown in the below screenshot.
2. Background layers and base maps
FeAST can be used while viewing different base maps depending on user preference. Click the map square located on bottom left to open a slider bar of base map options.
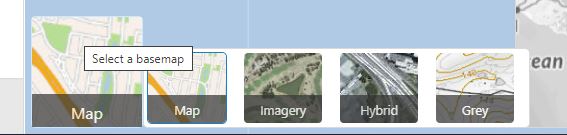
Base maps serve as a background reference map and are shown underneath any layers turned on. Base maps can be used to provide spatial context and further information about the location, environment or any features that might be present.
Map is the default base map on CoastKit and is a simplified colour cartographic map. It provides information on the topography and depicts key local elements such as towns, roads, waterways, urban areas and national parks. Zooming in and out will change the resolution of the information displayed on the map.
Imagery shows a statewide mosaic of the latest available aerial and satellite photography which has been stitched together as one seamless layer. Please note the imagery is limited in offshore areas.
No localities or roads are shown, use the Hybrid option.
Hybrid is a simple-styled overlay map that combines the main localities and roads with the Imagery base map.
Grey is a black and white cartographic map, with additional information on specific map elements such as points of interest, ferry crossing routes, walking tracks, vegetation, topographic contours and runways. The level of detail will change when zooming in and out.
Navigating to the Main tab on the top navigation menu and clicking the Turn on Greyscale icon will change any of the base map options to black and white and declutter the display.
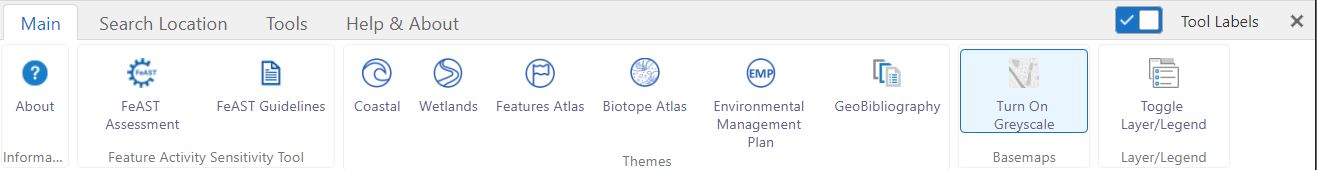
Additionally, FeAST can also be used while viewing other layers available on CoastKit. This functionality may be useful to inform the planning stages of a proposal to avoid key structures, habitats or features, identify administration boundaries or understand local conditions.
To access the full list of available layers while using the tool, click the Layers tab at the bottom of the left-hand side panel, next to Run FeAST Assessment tab, and the panel will toggle back to the default display.
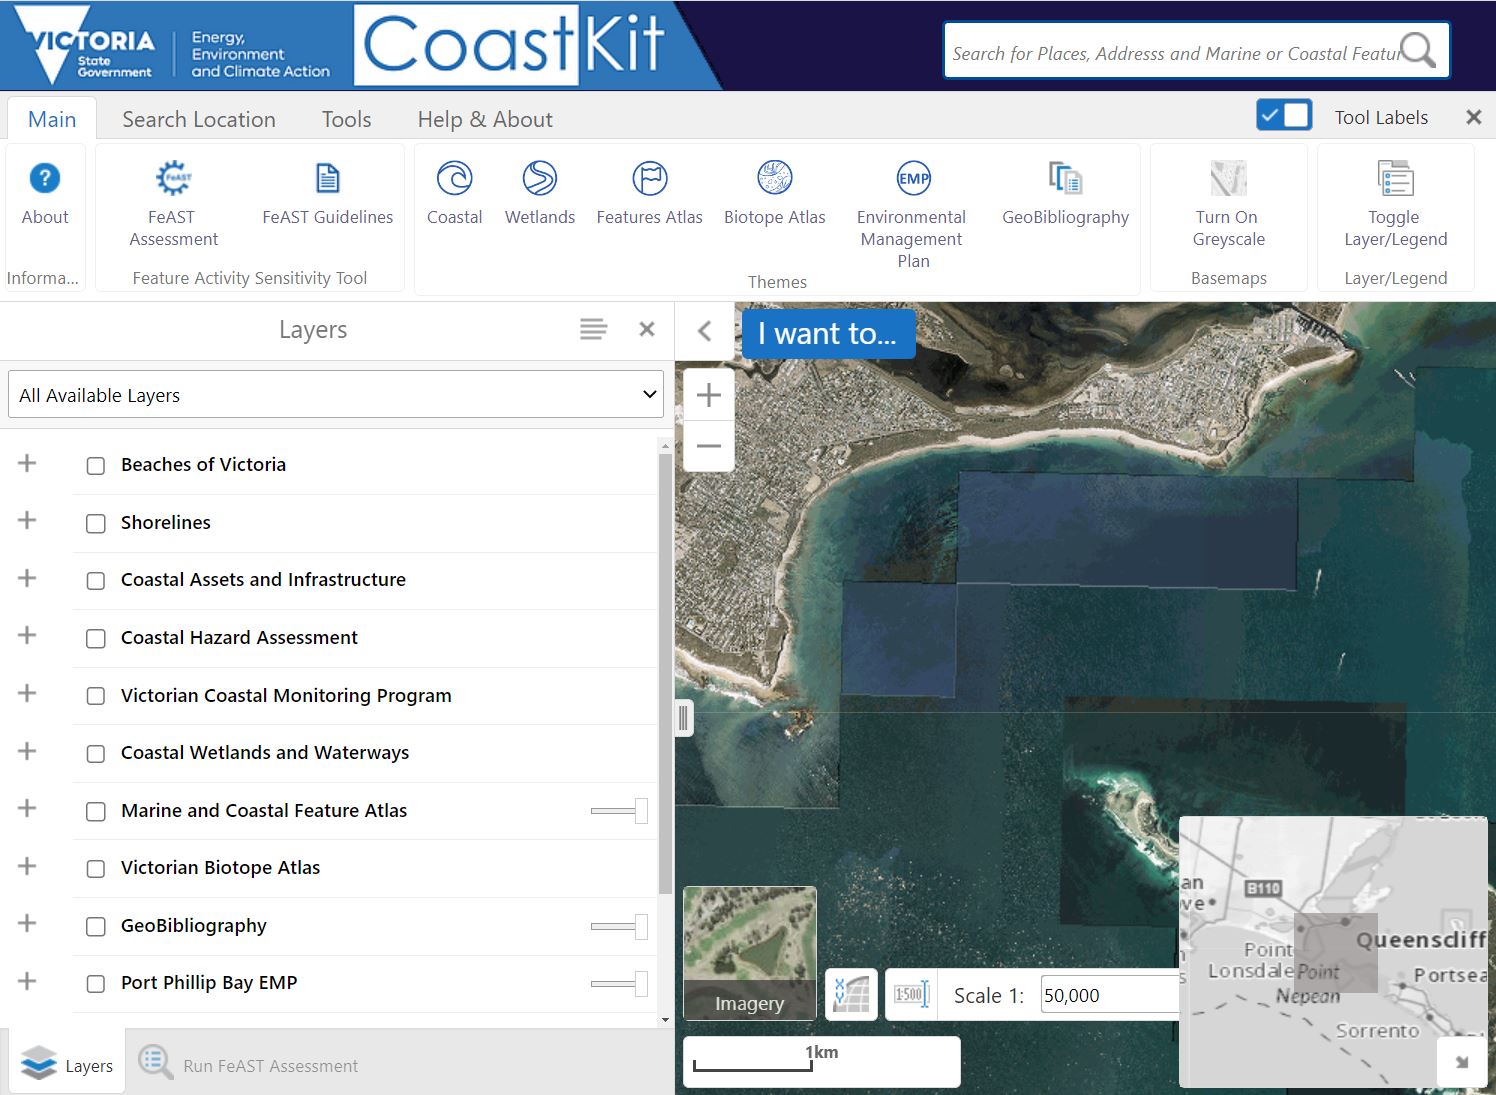
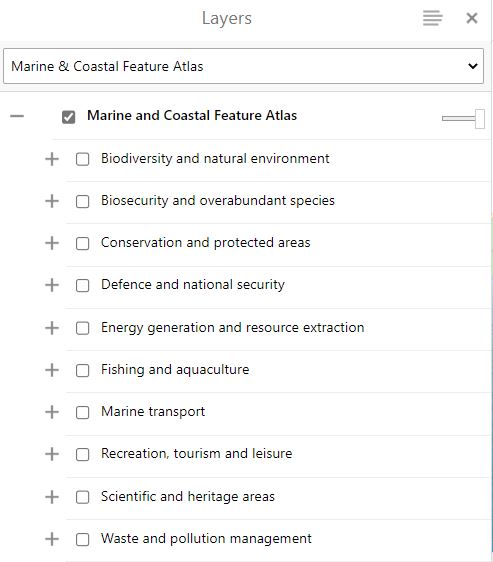
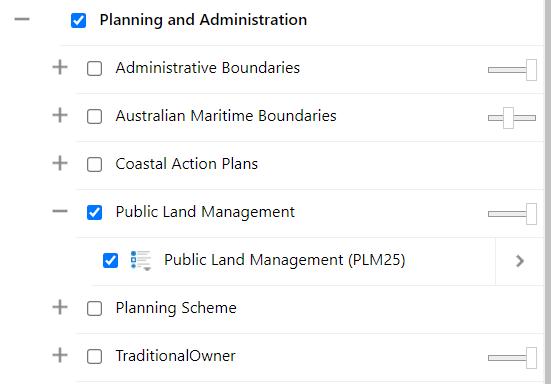
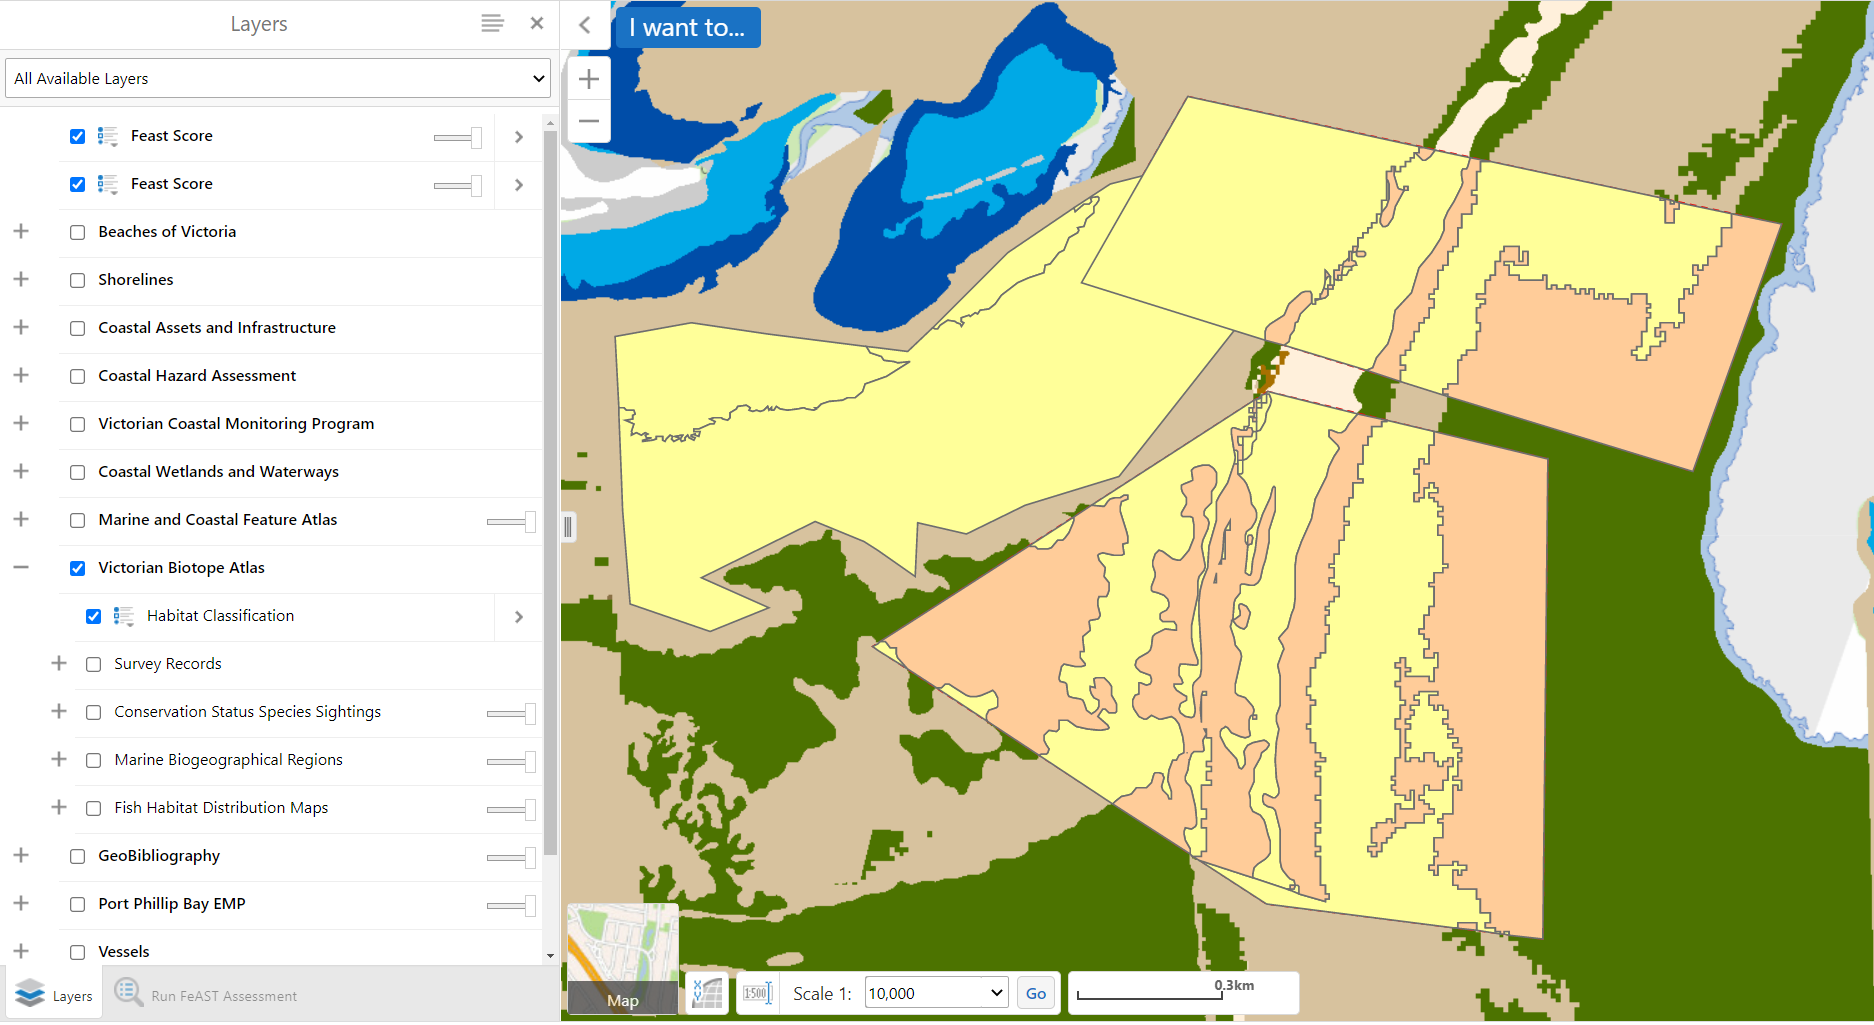
Individual layers on CoastKit have been organised into specific groupings or themes as in the image shown above. To turn on layers for display in CoastKit, click the checkbox next to the layer name and use the plus ![]() on the left to expand the layer group to see specific layers.
on the left to expand the layer group to see specific layers.
When a layer has been selected to be displayed using the checkbox ![]() , an icon
, an icon ![]() will appear on the left of the layer name. Click on this icon to see the legend information or symbol key for the specific layer.
will appear on the left of the layer name. Click on this icon to see the legend information or symbol key for the specific layer.
Alternatively, the Toggle Layer/ Legend button on the main navigation bar at the top shows the layers selected, the legend and drawing order of the layers on CoastKit. The table below provides a list of the buttons available on CoastKit and their functions.
| CoastKit button | Button name | Function |
|---|---|---|
| Expand layer group | Use to show the list of layers underneath. | |
| Collapse layer group | Use to hide the list of layers underneath. | |
| Toggle legend | Use to show the legend or key for any layer selected. | |
| Transparency slider | Use to change the transparency of the layer displayed on the map. Only available for some layers. | |
| Panel actions menu | Use this to access the option to display the legend for visible layers and to change the order of the layers drawn on the map. | |
| Expand/collapse the data frame | Use this to show or hide the left hand-side panel. | |
| Zooms in/ out a step | Use this to zoom in and out of the map. | |
| Map scale selector | Use this to change the scale of the map. | |
| Open and close coordinates widget | Use this to view or change the current coordinate system of the map, and see the latitude and longitude coordinates of the mouse pointer position. | |
 | Open and close the overview map | Use this to open and close the overview map of Victoria which shows the current map extent. |
Some layers that might be of interest to display while using FeAST include:
The Feature Atlas includes the layers used and displayed in the Proximity analysis.
The Feature Atlas holds conservation listed, natural environment and biodiversity distributions (limited data), conservation and protected areas such as the National Parks Act, UNESCO Ramsar sites, management areas and monitoring/dive sites.
It also displays information on the location of anthropogenic activities and structures such as fisheries, aquaculture, dredge areas, energy and resources. Some cultural and non-aboriginal heritage sites are also available for display.
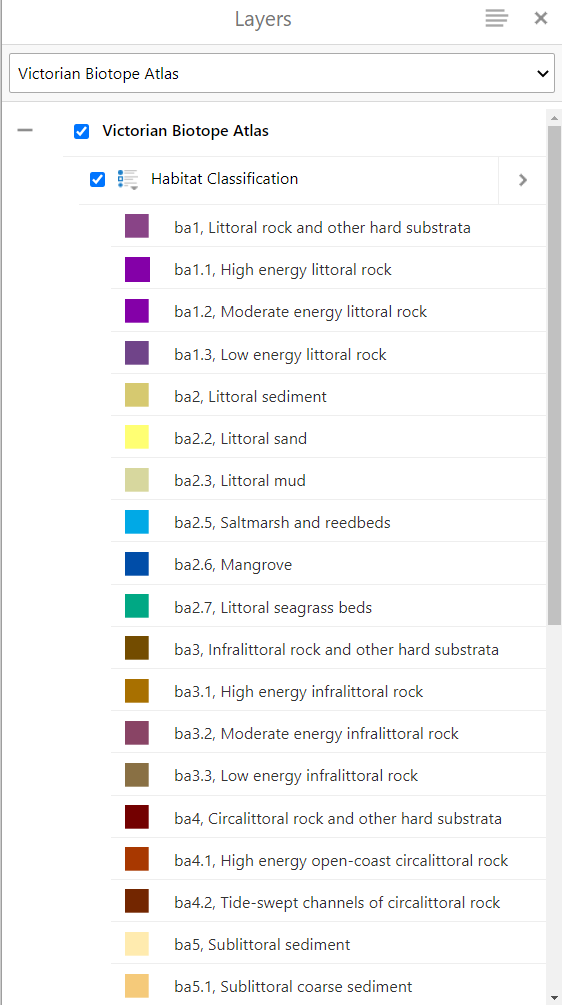
The statewide marine habitat mapping can be found on CoastKit under the Victorian Biotope Atlas and Habitat Classification.
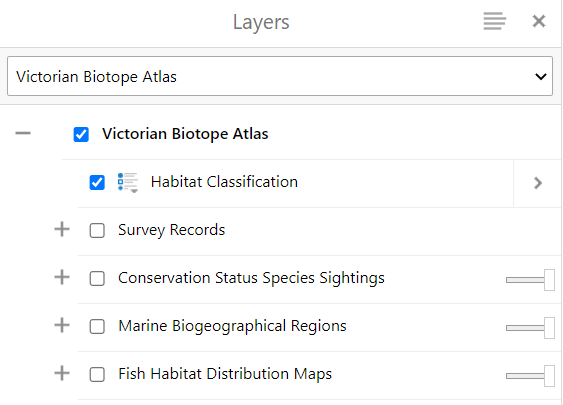
The habitat map represents 24 distinct habitats as classified to CBICS level 3, aligning with the habitats included in FeAST. The habitat map was constructed using 32,998 records of habitat observations, in combination with 28 environmental properties to model and predict the distribution of habitats across Victorian waters. For more information visit Victoria's marine habitat map.
The FeAST report identifies and lists the nearest Registered Aboriginal Parties to the defined project area. To find this layer on CoastKit click Planning and Administration then Traditional Owner.
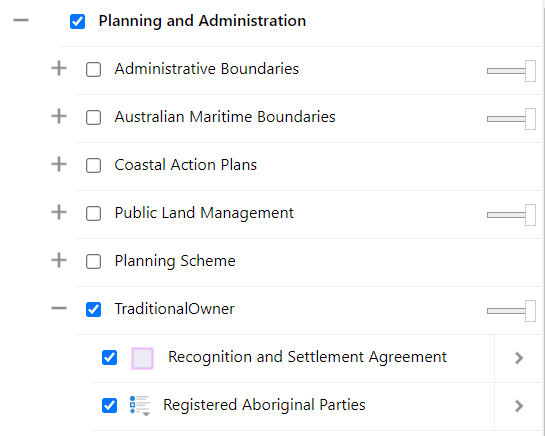
The Public Land Management layers show a range of public land use areas including Marine National Parks and Marine Sanctuaries. To find this on CoastKit, click on Planning and Administration > Public Land Management > Public Land Management (PLM25).
3. FeAST assessment titles
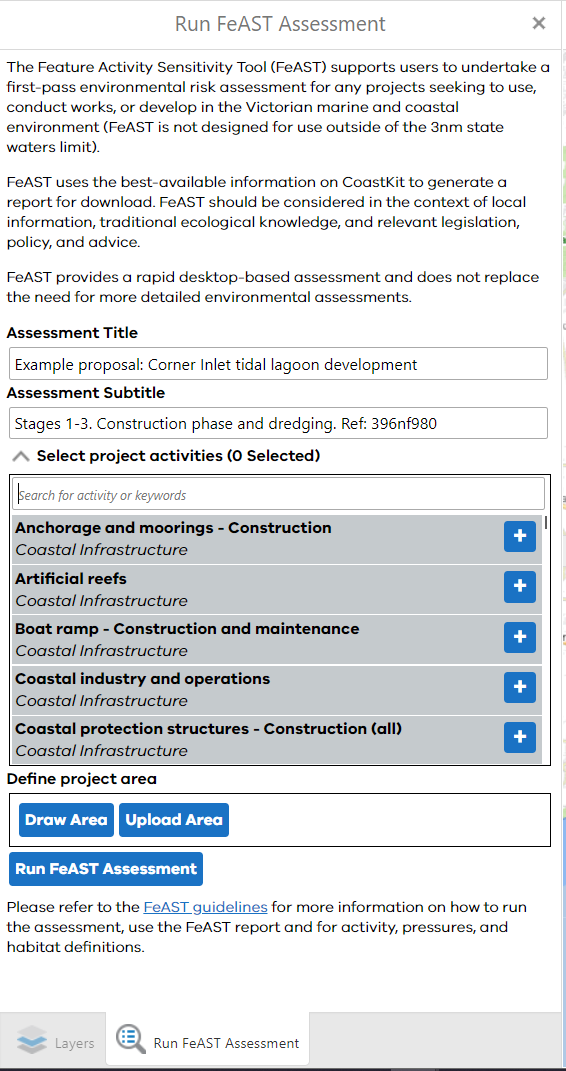
The ‘Assessment Title’ and ‘Assessment Subtitle’ are free text fields and will be displayed on the header of the generated FeAST assessment report. These titles should be relevant to your project and refer to the project name, project stage, site option or location. If you have reference numbers, make sure to include these in one of the titles.
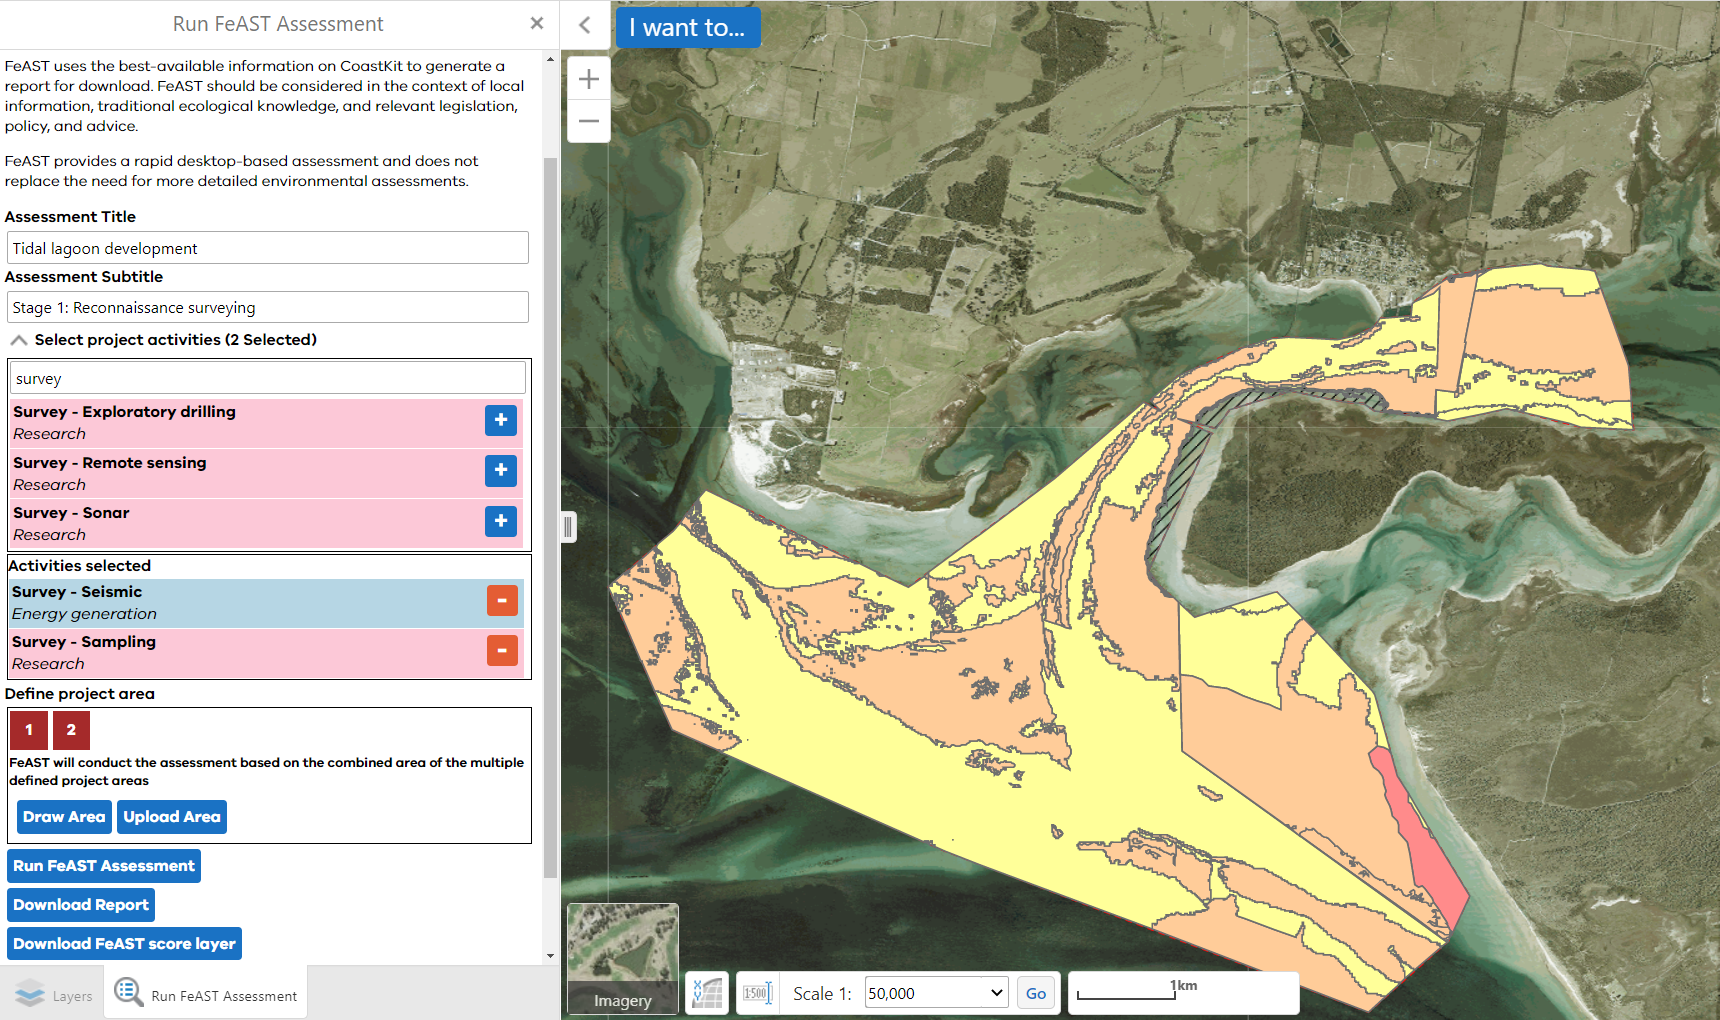
The image below shows a screenshot from the tool in CoastKit using the example case study. The assessment title is the project name, and the subtitle is the work involved, stages of the project and a unique application reference number.
4. Selecting project activities
The user must choose all relevant activities associated with the proposal to generate an accurate FeAST score. The activities selected must all occur in the activity area chosen, if activities occur in different areas multiple FeAST assessment reports must be created (see section 9).
The activities are shown in coloured groups to assist selection from over 130 possible activities. More detailed information on activities can be found on the Supporting information page. To find the relevant activities for your project:
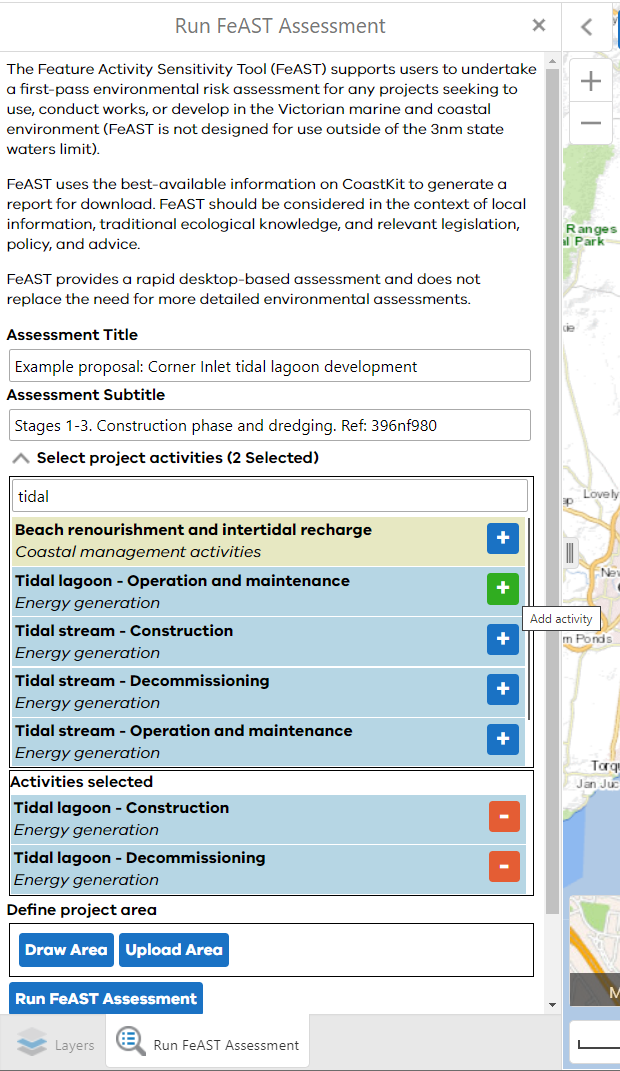
- Use the search bar to type part of the activity name or activity category. This will filter and display all activities that include what you typed.
- Use the scroll bar on the right-hand side of the activity selection menu or your mouse wheel to browse the list. To see the full list make sure to delete everything from the search box.
Use the plus button (+) to choose an activity, this will then be moved to the bottom box which displays all the chosen activities, see the example in the image below. Activities can also be removed from this box using the minus button (-).
There is no limit on the number of activities which can be selected for the FeAST risk assessment. The assessment will consider all these activities to calculate the FeAST score taking a precautionary approach, however it will not consider the cumulative impact of the combination of activities. More information on the limitations can be found on the Introduction to FeAST and Using the FeAST report pages.
The activities in the tool have been chosen based on existing uses, frequent works, or likely emerging sectors in Victoria. Despite this, there will be some cases when an activity associated with a proposal is not in the tool. Another activity may be suitable for substitution to run the FeAST assessment, this should be informed by activity description and pressure profile and agreed by the decision-maker (see the Supporting information page).
5. Defining the project area
Before the FeAST risk assessment can be run, users must define their full project area. Within the ‘Define project area’ box, there are two options to do this: draw area or upload area.
Click on the ‘Draw area’ blue button to manually draw the project area. Click the button to activate the drawing tool, start drawing the polygon by clicking on the map. A single-click adds a corner to the shape and a double-click finishes the polygon.
Click on the ‘Upload area’ blue button to upload any pre-prepared GIS files to the map. The GIS files will need to be polygonised, as the tool does not support point or line datasets, and be of the following formats .shp, .gpx, or a zip containing a FileGBD or shapefiles.
Click the button to open a pop-up box saying ‘Add data to Map’ where users can choose files from their computer to add. You will be prompted to change the name and symbolize the polygon. Click ‘Proceed’ to finalise, the map will zoom to the location of the uploaded area. Click the cross (x) in the top right of the pop-up box at any time to leave this option.
Each polygon created and added to the map is assigned a number and displayed in the ‘Define project area’ box. Multiple areas can be added using one or both methods and these areas can overlap or be distinct from each other. The user is responsible for ensuring all the areas associated with the proposal are included. In cases where multiple areas overlap, the tool will merge these areas to be assessed together without double counting.
To delete the drawn or uploaded project area, hover the cursor over the number of the polygon in the ‘Define project area’ box. This will highlight the polygon on the map with a blue outline and generate the message ‘Delete _?’. Click again to remove the polygon permanently from the assessment and map. The rolling numbering of each project area (i.e. 1, 2, 3) will continue from the last number deleted and does not refresh at 1 again (see section 7).
If you want to save the project areas, use the CoastKit drawing tools to create a shape and export. Toggle to the ‘Tools’ tab along the top main bar, within ‘Draw & Measure’, change the ‘Point’ tool to ‘Polygon’ using the drop-down arrow. Follow the prompts to draw your shapes and use the ‘Export Drawings’ tool to download files which can be uploaded for a FeAST assessment.
For more information on multiple project areas see sections 8 and 9.
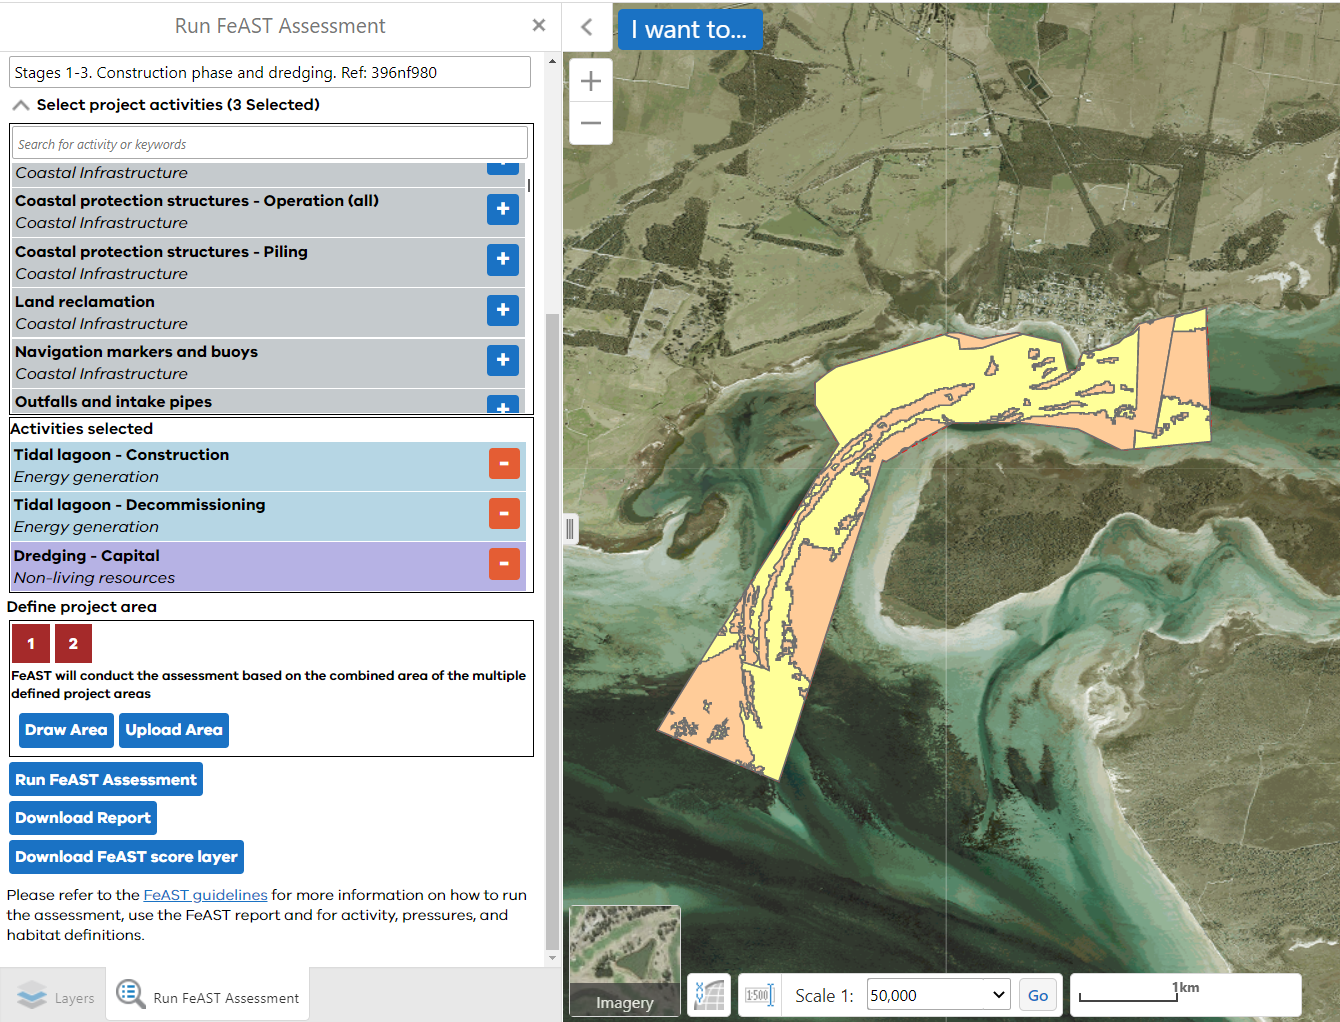
In the figure below, the base-map has been changed to display imagery basemap (see section 2) and the two project areas have been defined using the ‘Draw Area’ tool.

6. Generating the FeAST assessment report
Once all the above steps are completed the tool can run the FeAST assessment by selecting the blue ‘Run FeAST Assessment’ button. If the user has not completed any of the steps, an error message will be displayed as below:

The assessment will take a less than a minute to complete. Once complete, the tool will display two new buttons on the left-hand side panel:
This will download a PDF version of the FeAST assessment report, detailing the results from the FeAST risk assessment and the final FeAST score.
- This will download a GIS file of the mapped habitat risk and FeAST score as displayed on CoastKit.
You will notice the project areas now look different on the map. The project areas are now split by habitat and coloured according to the FeAST scores generated from the assessment as in the image below.
To interact with the project areas, click within the area to open a pop-up box that provides the Habitat type and the ‘FeAST score’. You can also print or save the current map shown on CoastKit. To do this use navigate to the ‘Tools’ tab in the top menu bar and select the option ‘Map with Legend’. See section 2 for how to add additional layers.
7. Re-running the FeAST assessment
Users may want or need to run several FeAST assessments in quick succession. When a new FeAST assessment is run, the previous FeAST assessment report is no longer available, and the new assessment will be based only on the information selected. However, the FeAST score layer is preserved and will stay displayed on the CoastKit map.
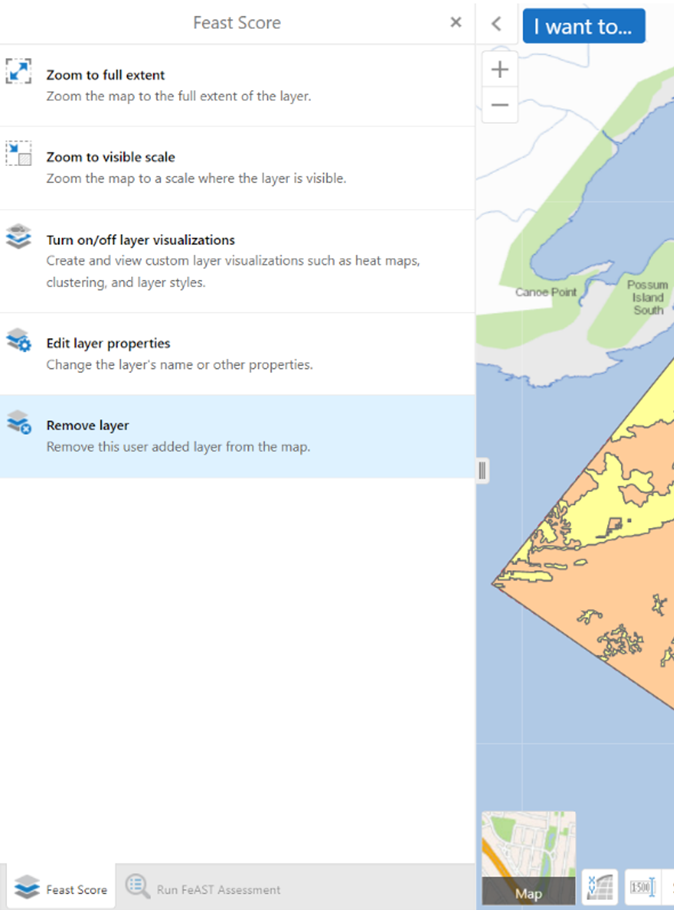
To amend or delete the FeAST score layer, toggle back to the ‘Layers’ tab on the bottom left-hand-side bar below the tool. At the top of the layer list is the ‘FeAST Score’ layer. Here you can view the legend, double click the name ‘FeAST score’ to rename the layer, you can use the slider bar to alter the transparency, hide the layer by unticking the checkbox, or use the arrow to the right to remove the layer permanently.

The rolling numbering of each project area i.e. 1, 2, 3, will continue from the last number deleted and does not refresh at 1 again.
Alternatively, refreshing the CoastKit site will restart the tool and remove this pre-existing data. Make sure to download and save the FeAST assessment report and FeAST score layer after running each assessment.
8. Options analysis: site selection
FeAST supports users to evaluate the most suitable sites for proposed activities. The tool assists users to assess options for the placement of activities to avoid most-at-risk habitats, marine and coastal features of importance and nearby activities. Additionally, the results can be used to refine the size of the project area.
To do this, the user is required to run separate FeAST assessments for each potential project area. The same set of activities must be selected to allow accurate comparison. When you have generated your first FeAST assessment report, make sure to download and save the report and FeAST score layer.
You can then delete the numbered project area and draw or upload another. Make sure to click ‘Run FeAST assessment’ and download the new report and layer when it has processed. You will see that both project areas you have run separate reports on are visible in the map. You can change which ones are shown by toggling back to the ‘Layers’ tab and checking and unchecking the new FeAST score layers at the top.
You should also compare the information in the FeAST assessment reports, particularly the Habitat scores, FeAST scores and Proximity analysis.
The below image shows the results of an options analysis for the example case study. The first project area avoids the seagrass (green) and mangrove (dark blue) habitats and was drawn using the habitat mapping on CoastKit, however the other two project areas cross multiple habitat types.
Three separate reports were generated for each area, showing one with a low FeAST score (yellow) and two with areas of both low (yellow) and medium (orange) FeAST scores.
9. Complex projects: multiple activities
Only one FeAST assessment is required if all the selected activities are planned to occur in the same project area.
However, there may be cases when a project has different activities occurring across multiple locations or within different parts of the overall project area and this will require multiple FeAST assessments.
Complex projects may also involve primary and secondary activities, which all need to be considered. For example, a project’s primary activity may be to construct a tidal lagoon, however, there are associated secondary activities that may be required, such as capital dredging, seismic surveying, installation of power cables, and the transportation of spoil materials by vessels. These activities may also occur in different project areas.
A project may also require an options analysis to evaluate which activities may be most suitable for an area (see section 8).
To run multiple FeAST risk assessments for multiple activities. Run the assessment as normal, making sure to use the titles and subtitles to differentiate between the different activities, and to download and save each report and FeAST score layer.
You will see that all the project areas you have run separate reports on are visible on the map. You can change which ones are shown by toggling back to the ‘Layers’ tab and checking and unchecking the new FeAST score layers at the top.
As you will be considering the different activities separately it will make it difficult to assess the risk to each habitat, see Introduction to FeAST and Using the FeAST report pages for more information.
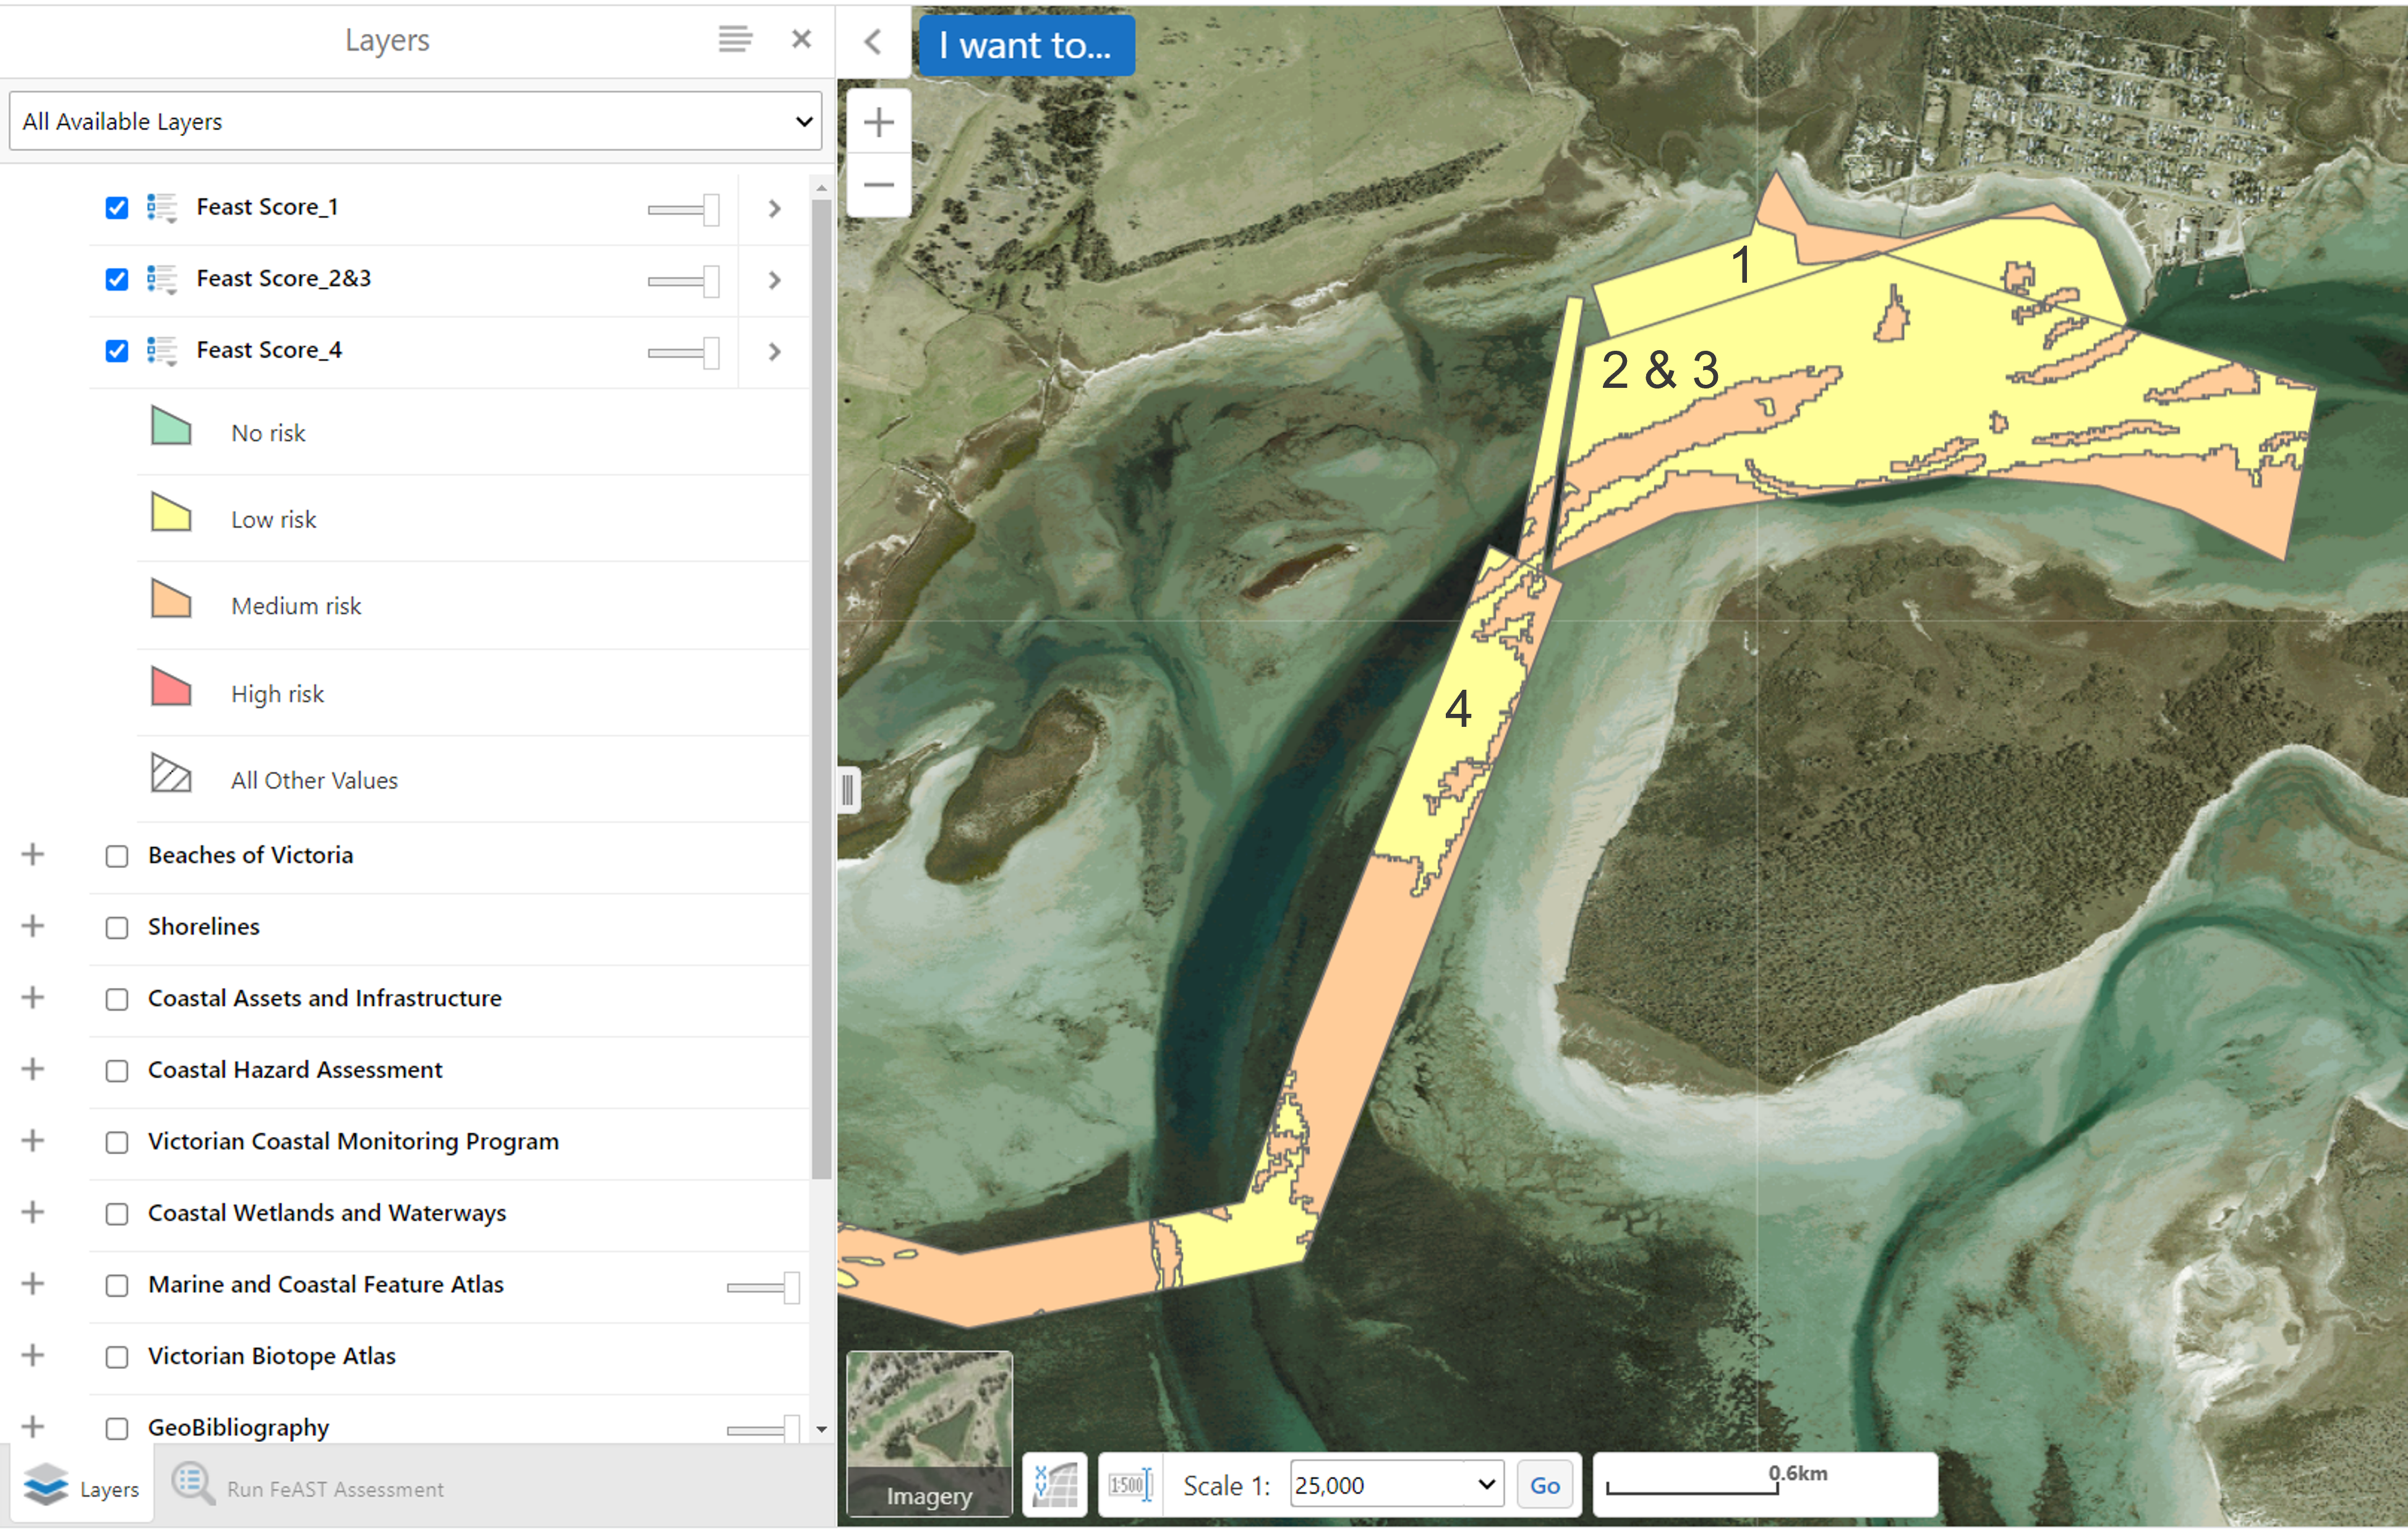
The figure below shows three separate FeAST assessments that have been run using the example case study. Each of the areas has a different set of activities planned to occur as part of the wider development of the tidal lagoon. For demonstration purposes, each area has been labelled. Area 1 includes capital dredging, Areas 2 & 3 construction of a coastal protection structure and tidal lagoon, and Area 4 installation of power cables
10. Projects with multiple stages
Typically, large-scale, or major projects have multiple stages of development during the life of the project. The stages may involve anything from exploratory surveying and sampling to the operation and maintenance, and even end of life decommissioning and rehabilitation of structures.
Each of the stages involve activities which may pose risks to the habitats within the project area. A proposal must account for all activities that will be undertaken during the duration of the project.
If all of the stages and activities will occur within the same project area a single FeAST risk assessment should be undertaken.
If the stages occur across different areas, for example pre-project surveying may occur over a much larger area than the development and operations stages. These two areas will require two separate FeAST reports for the relevant activities (see section 9).
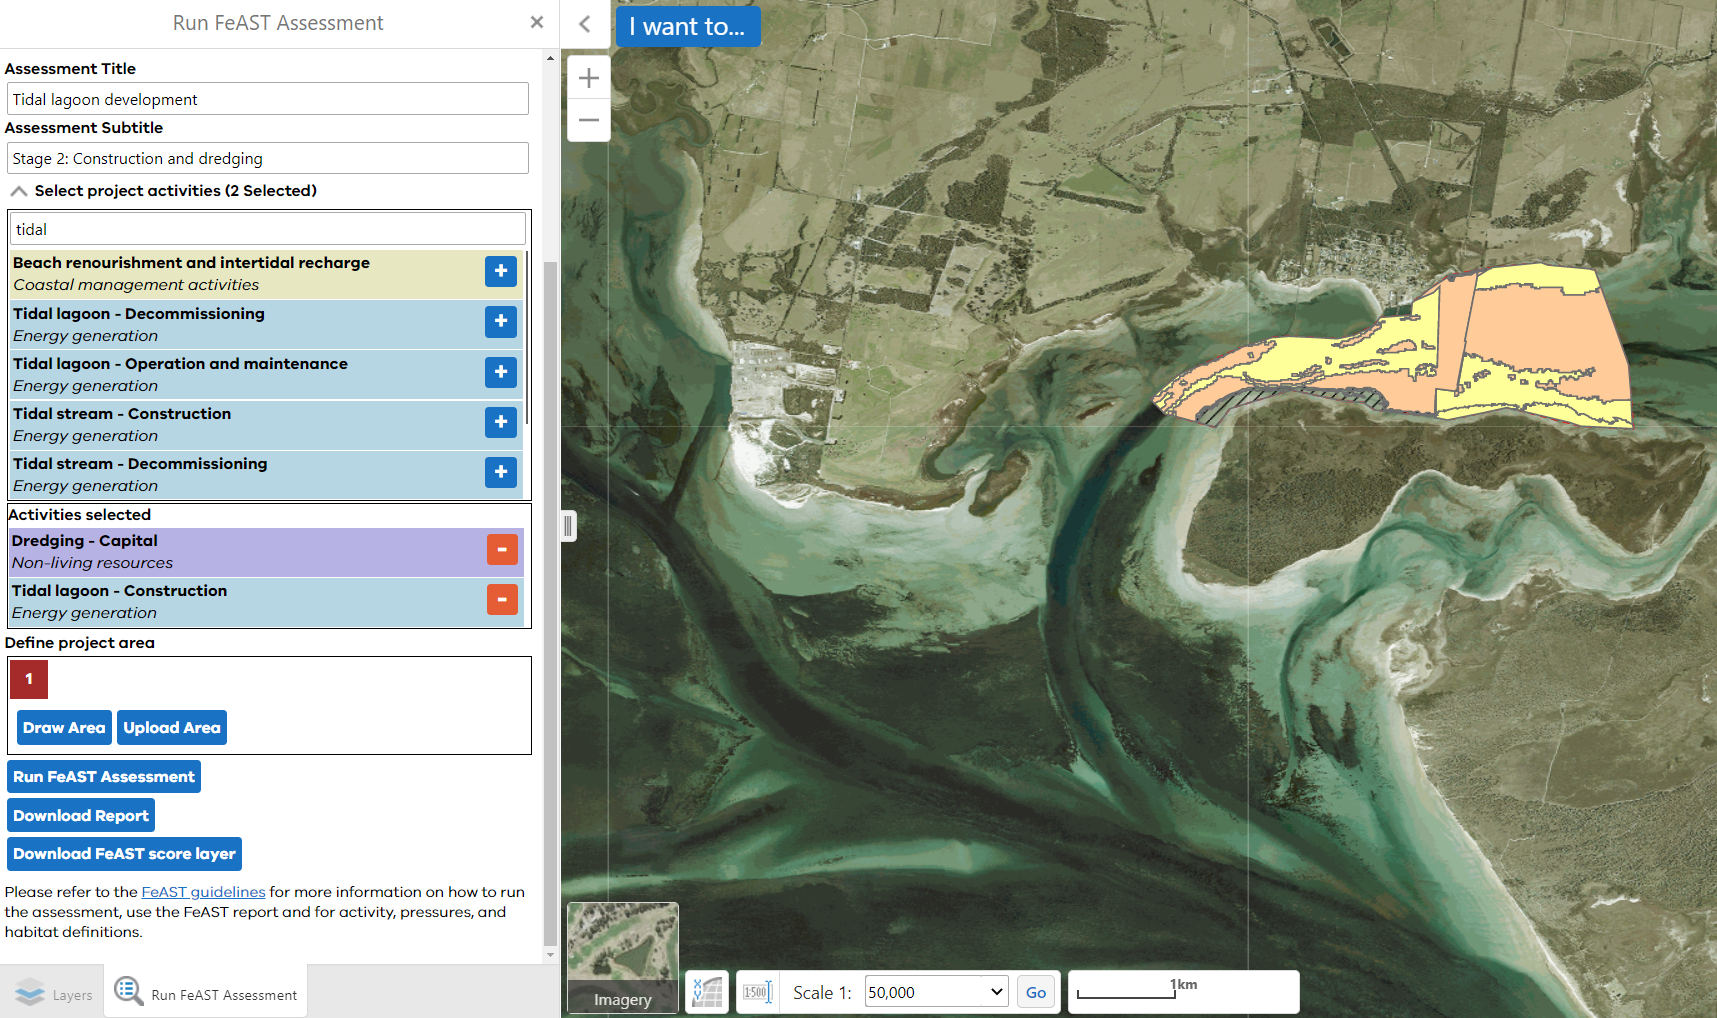
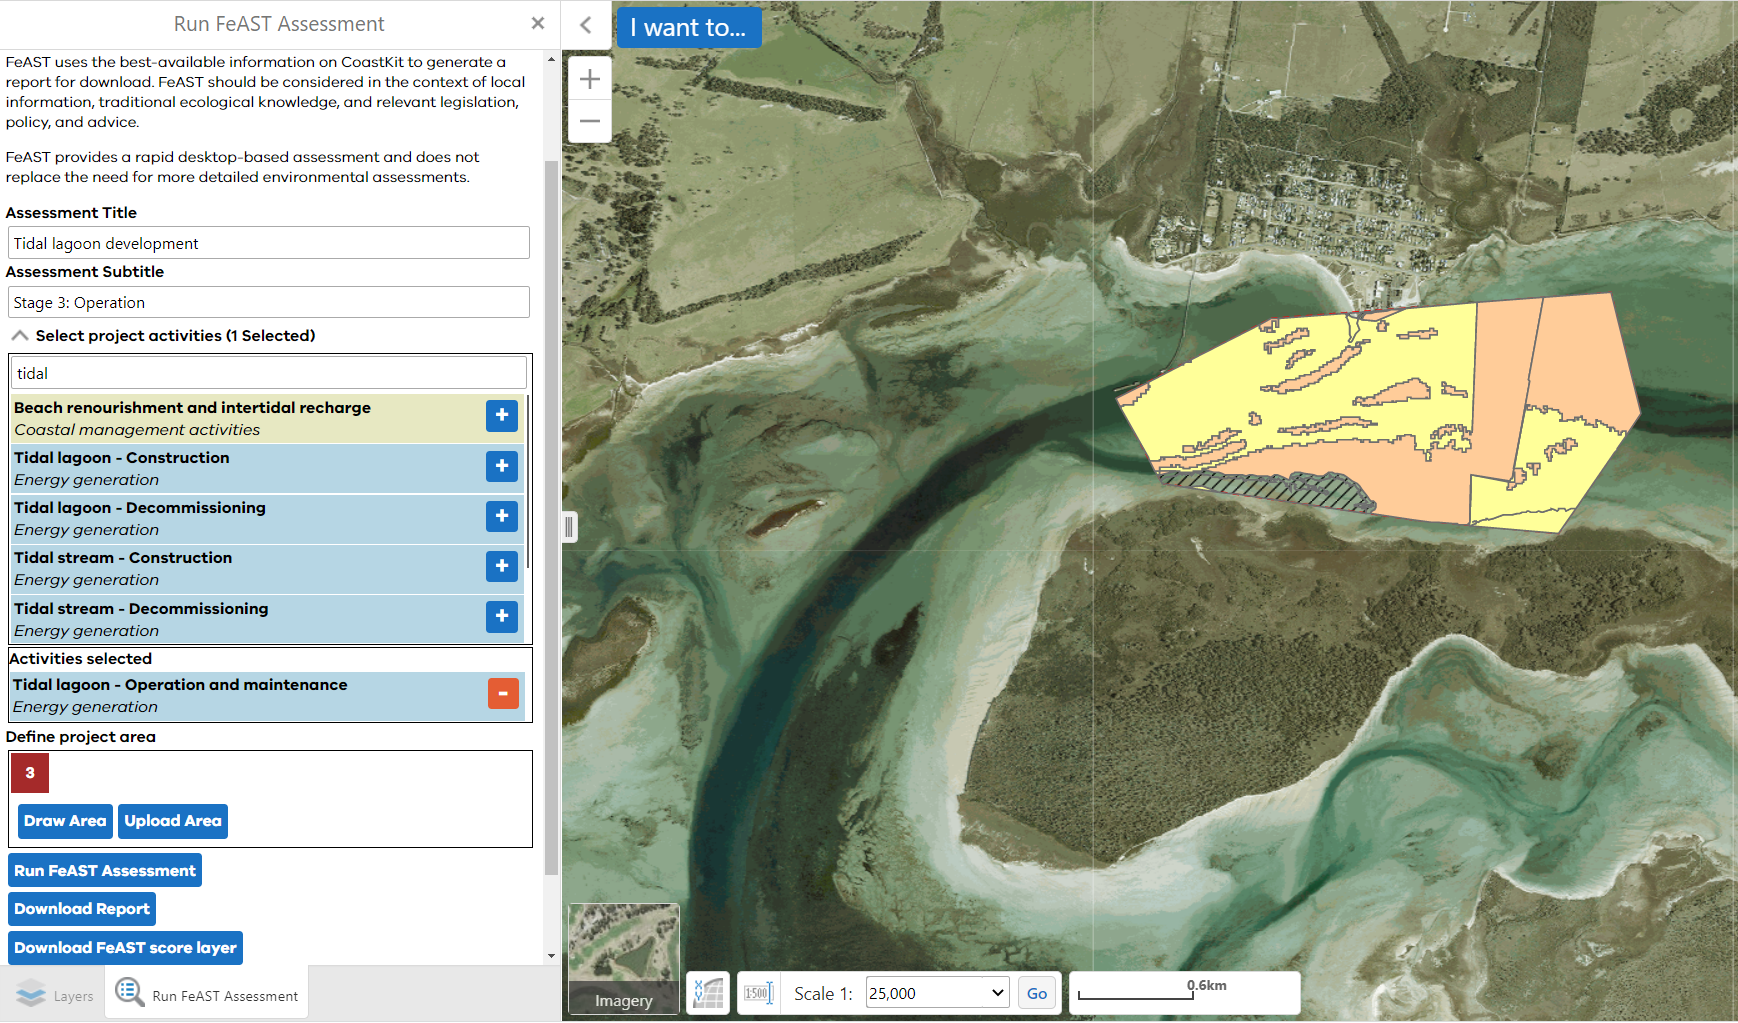
Using the case study example, we have identified three stages to use as examples and are presented in the images below in consecutive order:
- Stage 1: Surveying prior to construction.
- Stage 2: Construction and associated dredging.
- Stage 3: Operation.
Page last updated: 08/05/23