The Eutrophication Index (EI) is the evaluation method for reporting on nutrient inputs and responses to mitigate the potential risk of eutrophication in Port Phillip Bay and catchments. This is an integrated ecosystem-based approach, with identified indicators for reporting on the status, trends, and condition of key ecosystem components.
Eutrophication is defined as a process by which high-nutrient loads; stimulate plankton growth in the water column, including the formation of harmful algal blooms.
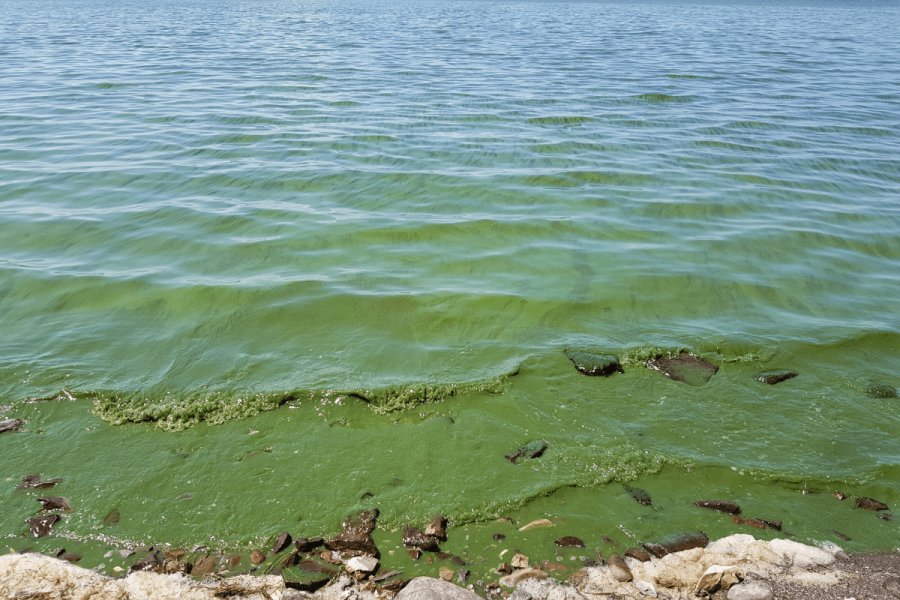 Photo credit: Water Research Australia
These blooms reduce the clarity of the water, negatively impacting bottom growing plants, such as seagrasses, that require light to grow. Excess algae and plant matter eventually decompose, using up oxygen, resulting in low-oxygen (hypoxic) waters that may harm fish and habitats. Finally, low-oxygen and high nutrient levels may impair natural nutrient cycling processes resulting in even more nutrients being released to the environment.
In Port Phillip Bay the mitigation of eutrophication is a management priority and an indicator of the overall condition of the Bay. This aligns with the Good Environmental Status (GES) descriptor for eutrophication where human-induced eutrophication is minimised, especially adverse effects thereof, such as losses in biodiversity, ecosystem degradation, harmful algae blooms and oxygen deficiency in bottom waters.
The EI is a multi-parametric index comprising 10 indicators (6 core and 4 secondary) classified into 3 categories as below, which aggregate up to the overall status. The indicators are weighted equally to be averaged for the category score.
The EI is a precautionary rating system which determines the overall EI status by using the one-out-all-out principle, with the lowest or worst percentage score across Category I, II and III being used. It assesses the potential of a eutrophication event occurring in Port Phillip Bay and identifies areas of concern across 4 ERS segments: Central East, Exchange, Geelong Arm and Hobsons Bay.
- Category I: Nutrient levels - has 4 core indicators; micrograms per litre of dissolved inorganic nitrogen, dissolved inorganic phosphorus, total nitrogen and total phosphorus. The indicators each have set nutrient levels agreed nationally. The target values for nutrients are based on a 75th percentile, data values must be lower than the target objective for each sub-segment at least 3-quarters of the year.
- Category II: Direct effects of nutrient enrichment - has one core indicator; micrograms per litre chlorophyll-a concentration. Targets have been defined in the Environment Reference Standard 2021 and the The Department of Energy, Environment and Climate Action's Algal Bloom Response Plan.
- Category III: Indirect effects of nutrient enrichment - has one core indicator; dissolved oxygen. The Environment Reference Standard 2021 defines a minimum and maximum range of percentage saturation of dissolved oxygen.
Based on available data, the EI can be applied at different spatial extents in a nested hierarchical structure. Reporting at smaller spatial scales is preferred, as the effects are often observed in highly localised areas. Assessment of eutrophication status for Port Phillip Bay is calculated at monitoring site level and summarised for reporting based on the Port Phillip Bay surface water compartments. Port Phillip Bay has 4 marine sub-segments (Hobsons Bay, Central-East, Geelong Arm and Exchange).
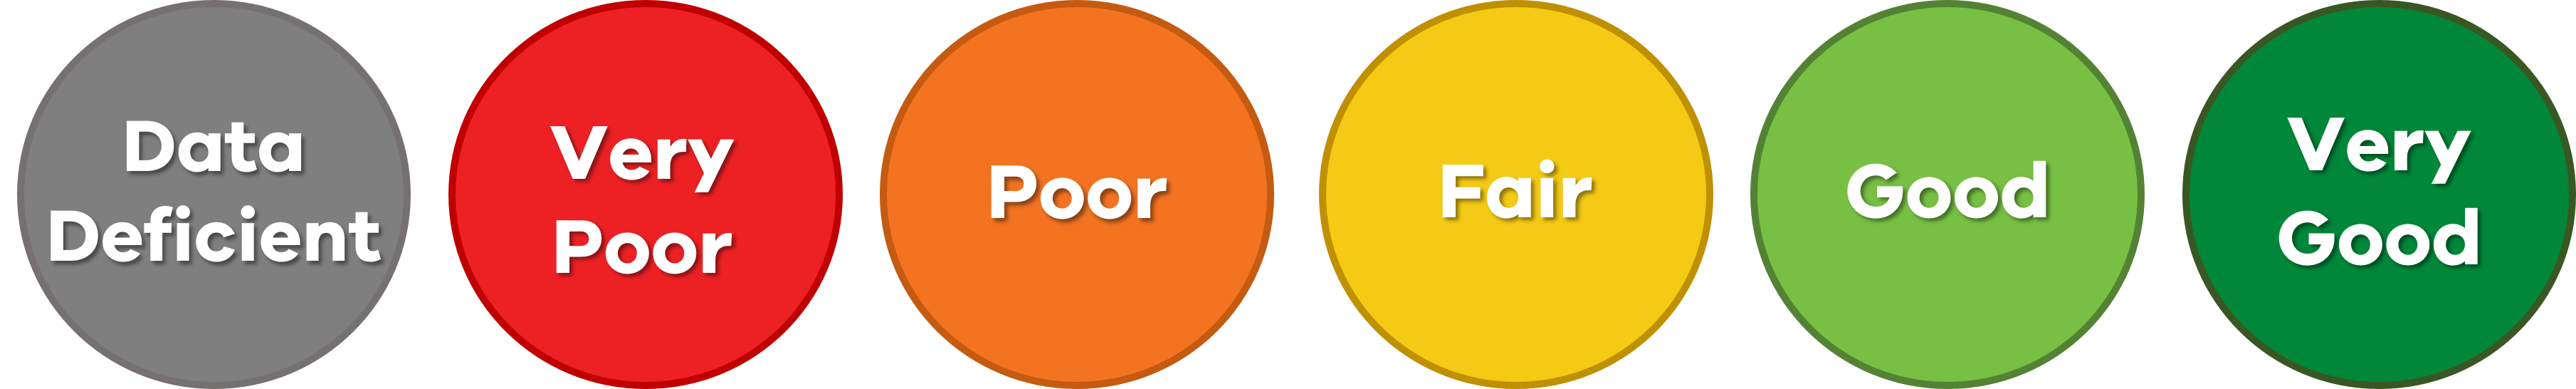
The EI will produce a status score as a normalised percentage (0 – 100%) for each indicator per financial year. There are 5 status categories, Very Poor to Fair represents a high eutrophication risk, and Good to Very Good represents a low eutrophication risk.
| Status | Description |
|---|---|
| Very Good | Percentage score of 80 - 100% |
| Good | Percentage score of 60 - 79% |
| Fair | Percentage score of 40 - 59% |
| Poor | Percentage score of 20 - 39% |
| Very Poor | Percentage score of 0 - 19% |
| Data Deficient | Not enough data to define a status, so the indicator is not assessed. |
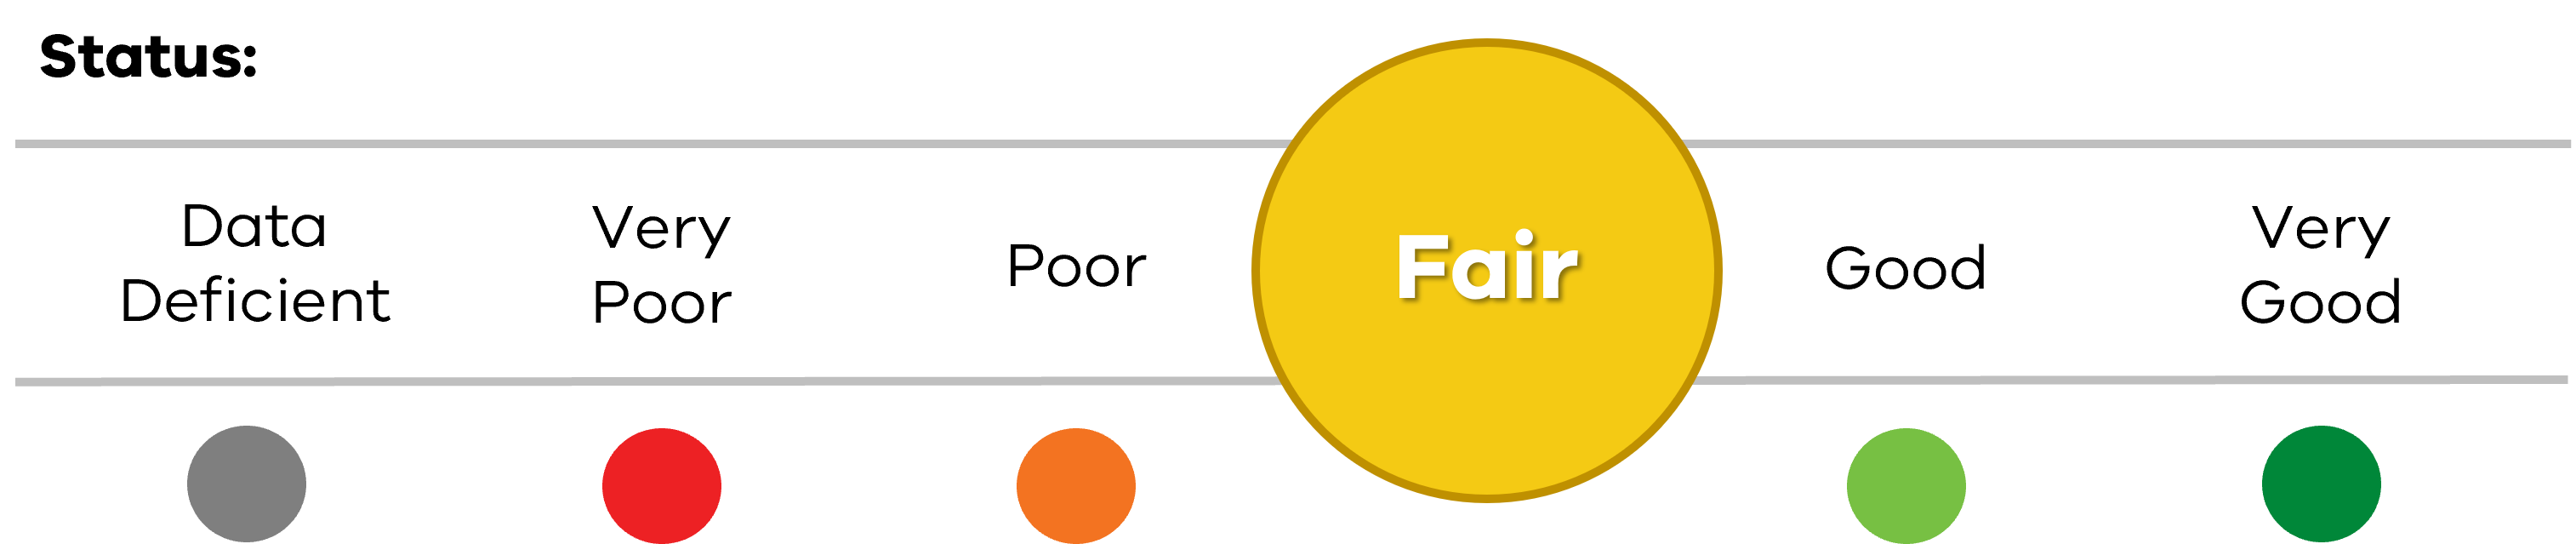
The current results for each indicator by the most recent financial year, will be displayed using a status bar with the status shown circled in the relevant colour.
The trend is determined by the change in status from the previous reporting period, either improving, declining or staying stable. The ratios and scores may improve or decline within a status category, but the trend only measures change in status.

Each individual indicator and grouped index have a data confidence score calculated to produce a value between zero and one. Data confidence is calculated by combining the following 4 metrics:
- Accuracy of indicator results based on frequency of sampling.
- Temporal coverage available.
- Spatial coverage across the assessment area.
- Methodological quality.
High, Medium and Low confidence scores are shown using circles: one filled circle being Low (score of < 0.5), two circles being Medium (0.5 – 0.75), three circles being High ( >0.75).

For more details see the Eutrophication Index report.
Page last updated: 11/11/24